Reversing & Exploiting with Free Tools: Part 3
In part two of this series, we learned to solve the exercise stack1 using x64dbg, debugging tool that allows us to analyze a program by running it, tracing it, even allowing us to set breakpoints, etc.
In those tools we’re not only running the program, we can also reach the function to analyze and execute it. But even when a tool like this is easy to use, there are many cases where it’s not necessary to run the program. A static analysis would be enough, getting conclusions without running the application or running the minimum possible amount. Static analysis can typically be used in malware analysis, function analysis of programs that don’t run, research of vulnerabilities, code reconstruction and more.
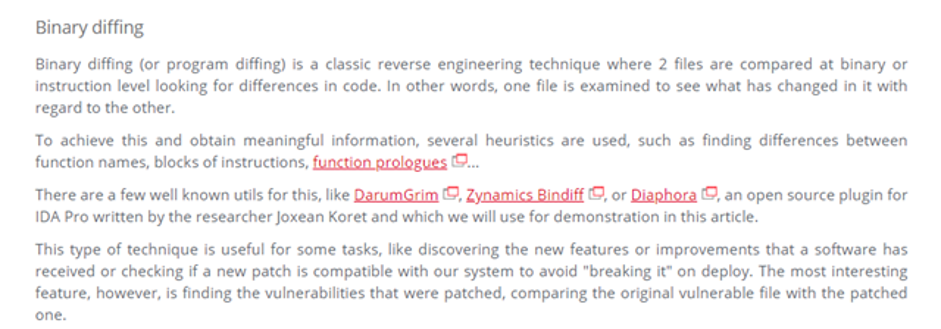
In the case of exploit writers, when they analyze a program patch that fixes a program vulnerability, they usually do something called binary diffing or diff. A diff is when we use a tool to compare the vulnerable version with the patched one to figure out if and how the patch solved the issue. This the exact stage of the vulnerability to start developing an exploit.
The problem with this approach is that there could be hundreds of changed functions and not all of them are patches. Most of them are little fixes, new functionalities, or minor changes only. To examine all the changes individually to uncover which one is responsible for the fix requires so much complex analysis and debugging that it’s simply unfeasible. We don’t even know how to reach some program functions, which could require testing thousands of combinations in order access the function, making the work far too time consuming.
Antonio Rodriguez of Incibe explains binary diffing as follows:
As part of the training, there will be a few exercises of binary diffing to find patches.
There are some disassembler programs that are interactive, so those not only show the functions and instructions but allow us (according to reversing experts) detection functionality of each one and working with what we’ll see it is the static reversing.
In general, static reversing is a powerful technique when mastered and helps us to find a correct path to the wanted function, and it can sometimes complement dynamic reversing.
We have to master and gain expertise of all the techniques for later use and to combine them as best as possible to meet our goals.
Static reversing also depends on if the programs contain symbols. When you installed Windbg you should have configured a folder for symbols where symbols will be downloaded automatically. This should happen for most of the system binary files. If we program something, you should be able to compile and save symbols in a file with the pdb extension.
At the moment, your symbols folder is most likely empty now. As you start working with windbg, IDA symbols will be downloaded and saved in there.
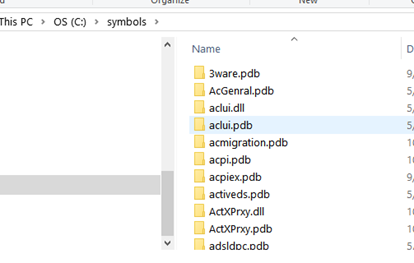
Having symbols makes the static analysis easier, so we will start the stack1 analysis with these symbols. Later you will find some cases where symbols are not available, which will require additional steps and skills in the static reversing. For example, this will not happen with third party programs that are not part of the operating system.

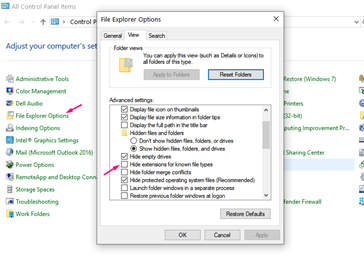
In the exercise folder, there are three files that correspond to stack1: the executable binary file with EXE extension, the source code CPP, and the symbols files PDB (if you can’t see the extension, go to the folder options or file explorer options in the Windows 10 versions and uncheck ”Hide extensions for known file types.”
Static Reversing
Exercise Stack1
1-IDA FREE
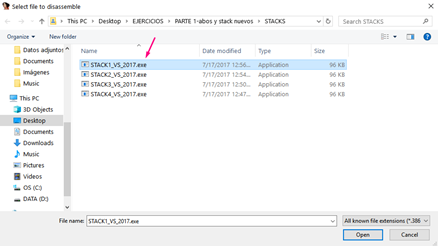
We can now see the file extensions and can begin opening the executable one with IDA FREE. Drag the file to the IDA icon or open IDA, which will prompt us to open a file. Search for the .exe file and open it.
Select “NEW” to work with a new analysis file:

Search the stack1 executable.
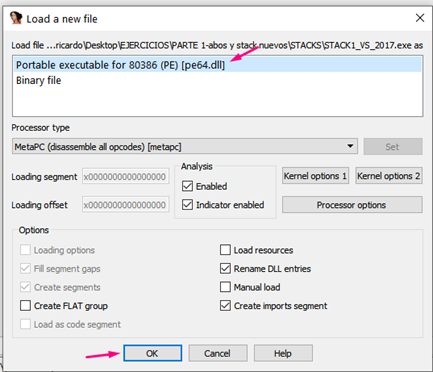
It will detect that the executable is a PE exe file. Since IDA FREE does not come with two versions (one for 32 bits and other for 64 bits), it will say that the binary is a 64 bit, which also work.
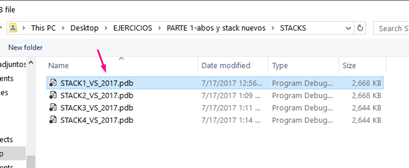
If it says that it can’t find the pdb because it’s not in the symbols folder, click “YES” and search for symbols manually:

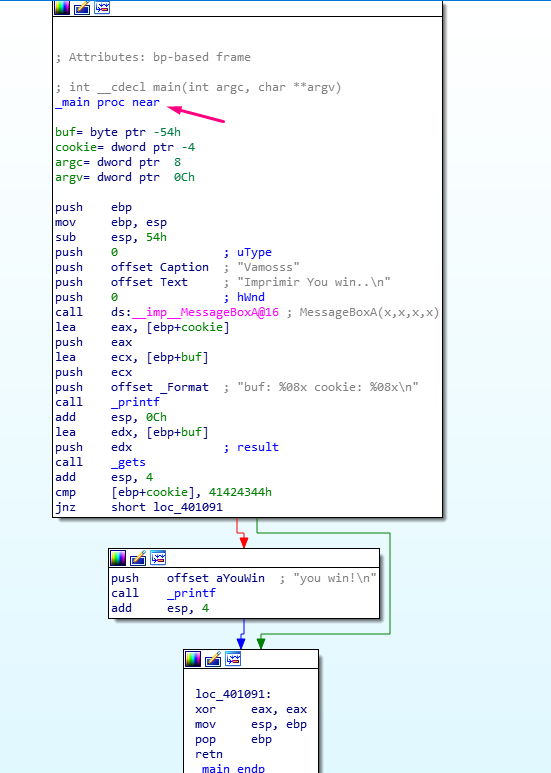
As IDA loads the symbols, it will detect the main function and displays it directly.
Only the pro version of IDA free has a decompiler. IDA FREE does not have a decompiler, so pressing F5, which is the shortcut in the PRO version for decompile a function will just say:

In the image, the comparison between printf and gets for the cookie with the value 0x41424344. If the values are not the same, it will follow the path of either the green arrow or the red arrow.
GREEN ARROW = Conditional jump result is true.
RED ARROW = Conditional jump result is false.
In this particular case, the parameters are that
JNZ (jump if not zero) or JNE (jump if not equal) = TRUE which means that it will go through the green arrow if values are not the same and through the red arrow if they are the same. In our example, the value is not the same, which means it will be following the green arrow.
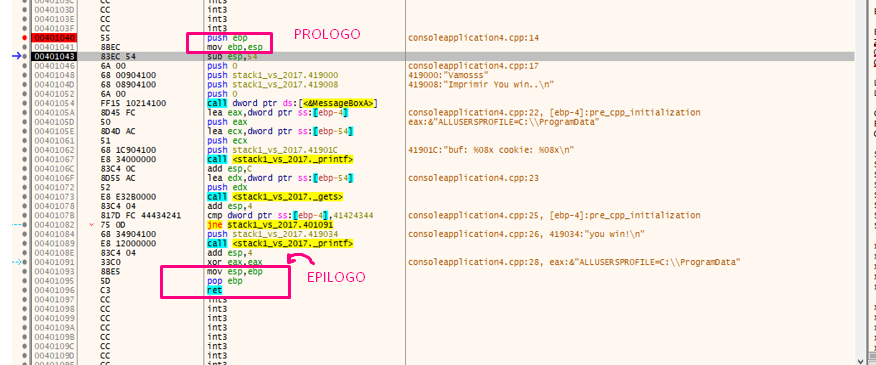
It’s worth keeping in mind what we saw in the x64dbg debugger, which we can compare with what we see in IDA.
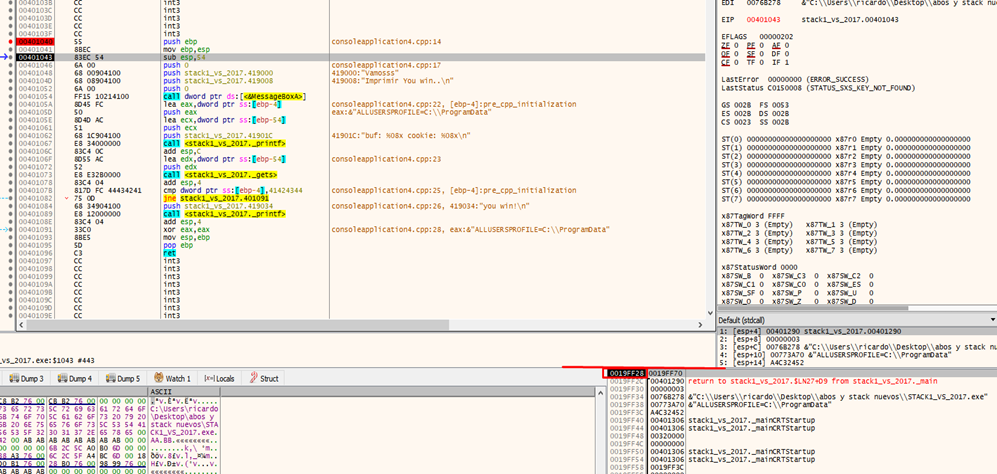
Remember that after the PROLOGUE function, EBP was set as a frame pointer and the function was EBP BASED, so the EBP value would be constant until the EPILOGUE. All the variables and parameters that remained constant and were referenced using EBP were called the HORIZON.
The HORIZON line can be seen in the stack:
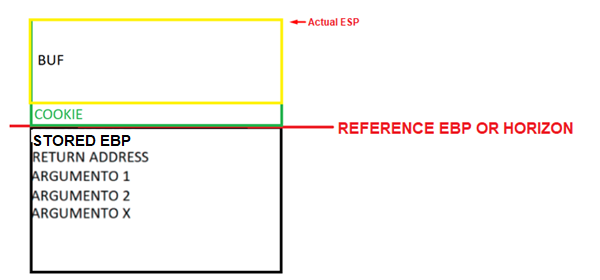
Under the HORIZON was the STORED EBP, the RETURN ADDRESS, and the function parameters. Above the HORIZON was space reserved for the variables using the instruction SUB ESP, 0x54 finishing ESP above EBP, which remains a fixed-value.
But as we saw previously that while ESP moves in different moments of the function, EBP remains constant. This means that the map will be the distribution of the variables and parameters of the function but will not change as EBP doesn’t change.
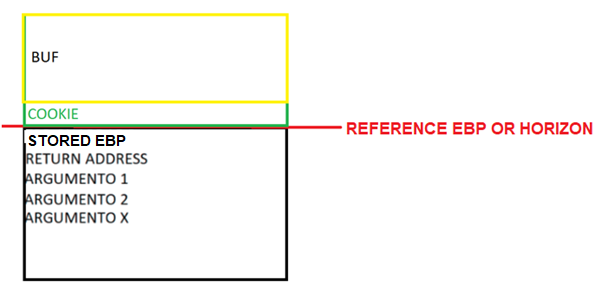
We built this map tracing in the x64dbg debugger, but we can also see it in IDA without running the program.
IDA has the list of variables and parameters under the function declaration. However, it’s not the same complete map. To access that, double click in any variable or parameter:
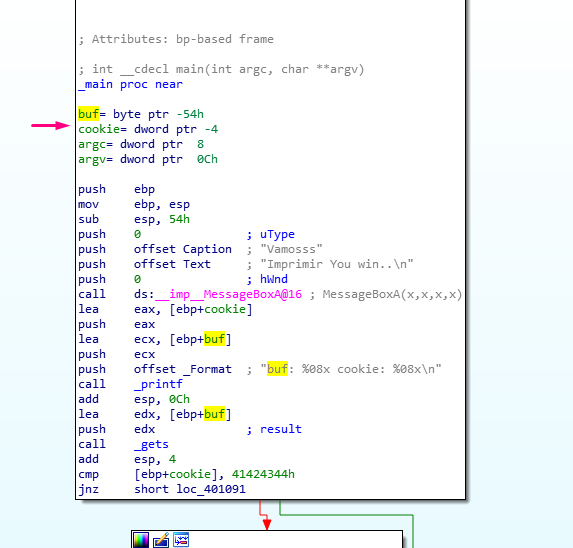
This will display the STATIC REPRESENTATION OF THE STACK, which is the same map as the one from x64dbg.
This shows a picture of the entire stack with the variables, the parameters, STORED EBP, RETURN ADDRESS, the HORIZON, etc.
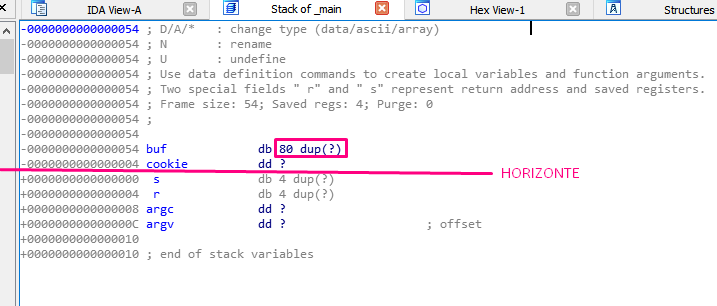
Note the following definitions in IDA:
db: BYTE=1 byte long
dw: WORD=2 bytes long
dd: DWORD=4 bytes long
In the above example, the variable buf (type db) is an 80 byte long byte array.

The dup(?) notation means duplication, meaning that it should repeat as many times as in indicated in the parentheses. Since there is a question mark in the parentheses, it will repeat with an unknown value for the static analysis.
The next variable in the example is cookie (type dd), and is four bytes long. As with buf, the question mark means an unknown value. Unlike buf, there is no need to repeat any value, since there is no dup.
After the cookie, comes the s that it is below the HORIZON in the STORED EBP. The s is 4 bytes long. Though IDA prints it as a db of 4 bytes long, it really is a dd (DWORD). This is just a quirk in the IDA representation.
After s, r is the RETURN ADDRESS and similarly has a length of 4 bytes.
Next, both argc and argv are properly detected as DWORDS, making them both 4 bytes long.

While the stack representation displays the length of each variable, if we right click any of them, we’ll also see the definition of the type according to the C language:


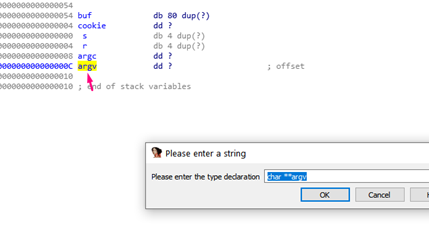
IDA can detect names and exact values because it uses the symbols. But what happens when it doesn’t have symbols?
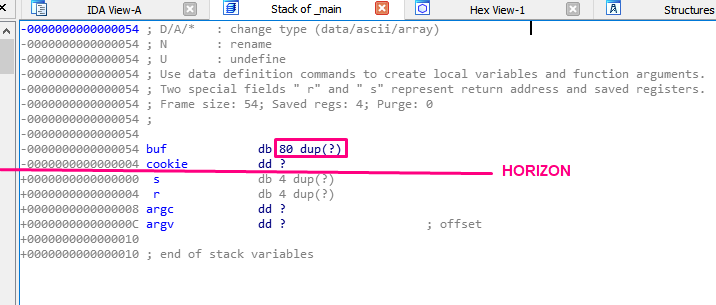
Returning to the map we see in the first column we see the same values of distance use horizon as reference as were in the stack in x64dbg with the horizon set to zero. Above the horizon, variables are represented as EBP-XXX, while below the parameters are represented as EBP+XXX.
For example, buf is EBP-0x54, as seen below:
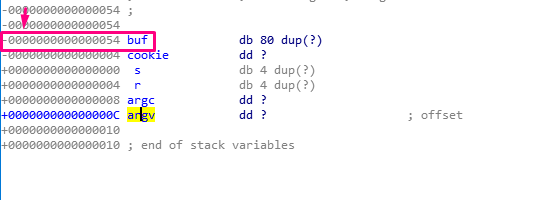
Additionally, cookie is EBP-4, while argc is EBP+8 and argv is EBP+C.
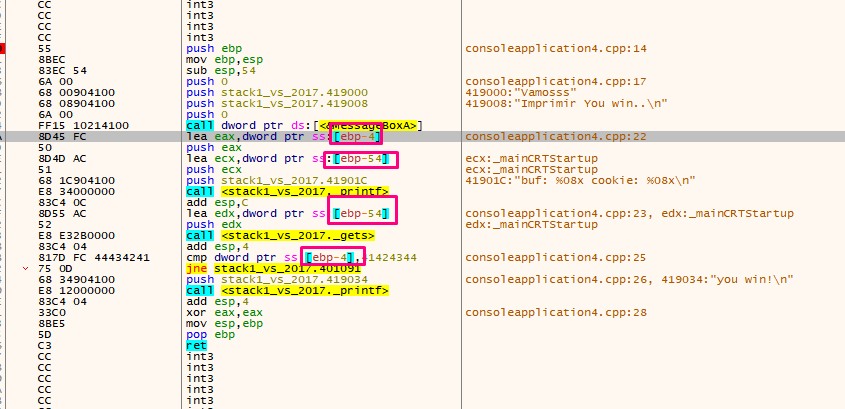
The ebp-0x4 and ebp-0x54 representations of cookie and buf are the same in x64dbg.
In IDA, if I right click on a variable, like ebp+cookie, it will display in the alternative format of ebp-4 because cookie is in the position -4.
ebp + cookie = ebp + (-4) = ebp - 4
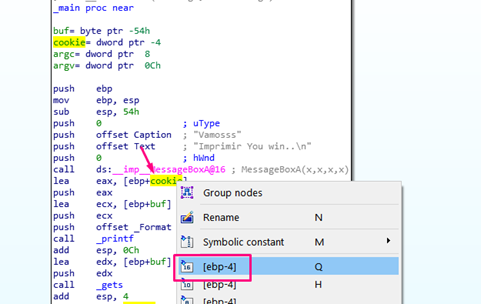
We can see the position with respect to EBP below:
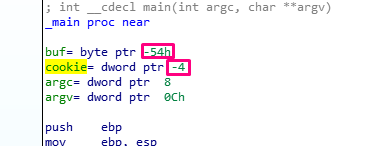
So far, everything we know has been analyzed in IDA. The last piece we need is the distance needed to fill to overflow the buffer and modify the cookie.
This can be seen in the static stack representation:

We have to fill the 80 bytes of buf, and then the 4 bytes of the cookie, which, when we look at buf and cookie in IDA, is compared against 0x41424344:
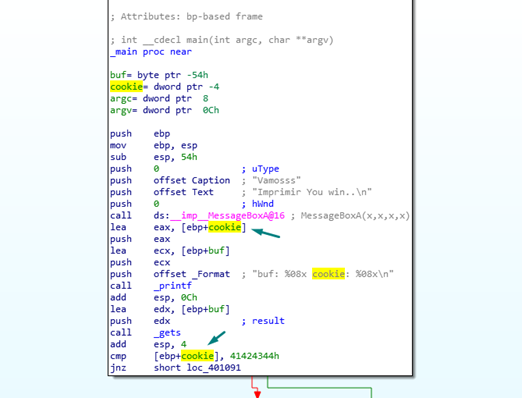
In the image we can see all the places where cookie is exceeded. The LEA instruction is similar to AMPERSAND, so it gets the address of a variable instead of its value. This can happen using printf to print the address in hexadecimal for the %08x.
Additionally, we can see that gets receives the address of buf as parameters, so it will copy whatever we type in the keyboard. For instance, if we type:
80 Aes + “DCBA”
Since DCBA is 44 43 42 41, reading it in memory as little endian will be the same when it is compared to 0x41424344. This means it will go the program through the red arrow as the instruction JNE=NOT TRUE is used, completing the sequence.
The script is similar to the one we saw in the last part:
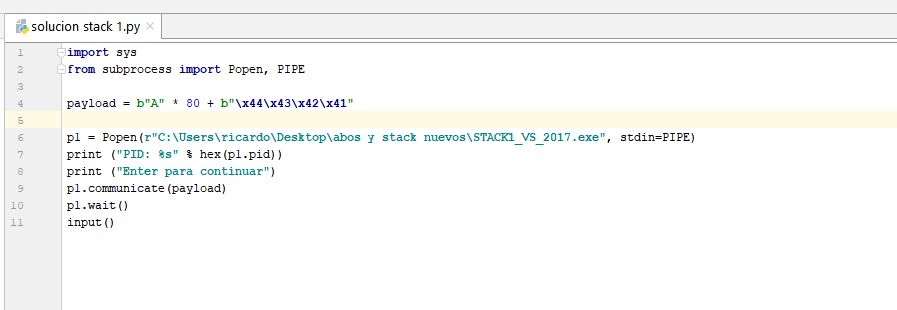
If we use Popen to redirect the input STDIN, we can send the data from the script with p1.communicate(payload) instead of typing.
Payload: the code of an exploit which completes the malicious part of the intrusion. This remote code can be executed in the attacked machine, performing a sequence of malicious activities.
In this case the payload is = 80 As + “DCBA” # (“\x44\x43\x42\x41” is similar to “DCBA”)
Running the script, with what is deducted from the static reversing using IDA without running the exercise, we successfully get the YOU WIN without problems.

2-RADARE
First, we should check the binary’s information, which can be done with an executable called rabin2, located in the same folder where Radare was installed.
rabin2 -l name
This returns the binary’s information and it contains information that we can check with the argument -h.
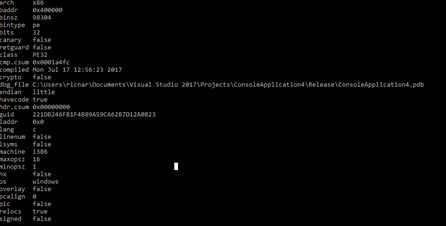
For example, the argument -i is used to see the imports used by the executable:
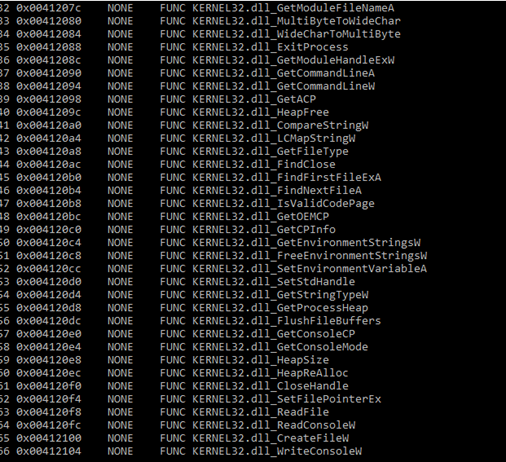
Below are some of the different options to get additional information.
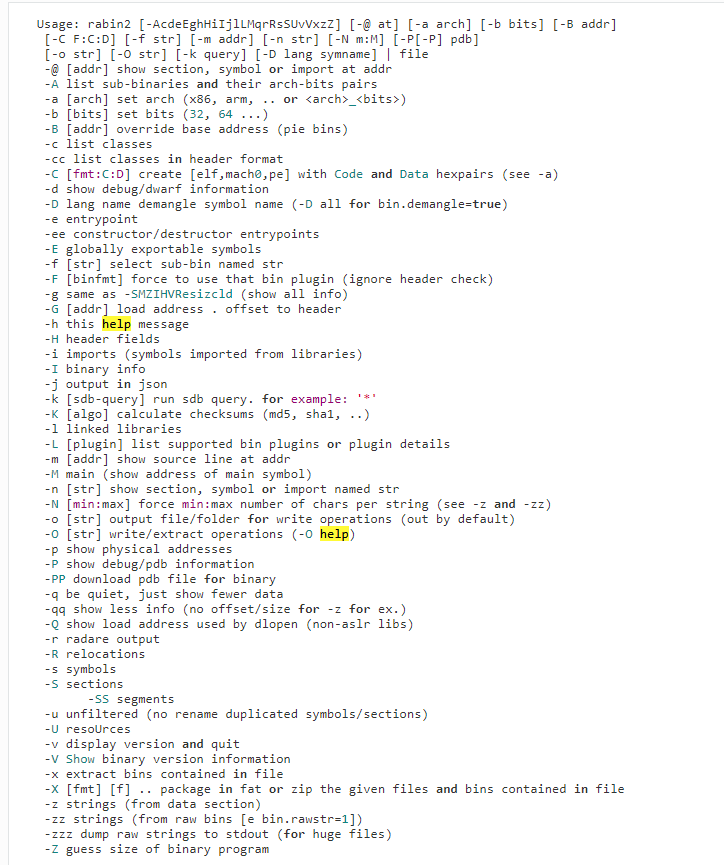
To start using Radare, write the following in a command prompt:
radare2 STACK1_VS_2017.exe
This will load the binary to analyze it.
Then execute the command aaa to analyze the loaded binary.

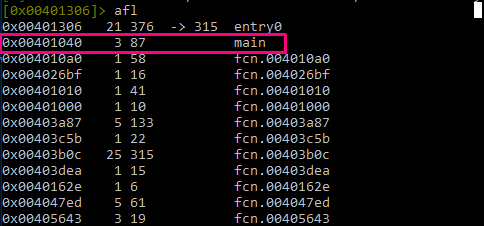
Then, the command afl will load all the functions. From here, we can find the main function, which is in the address 0x401040.
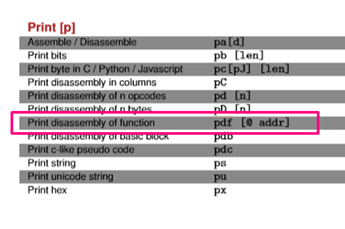
With the command pdf we can disassemble a function:
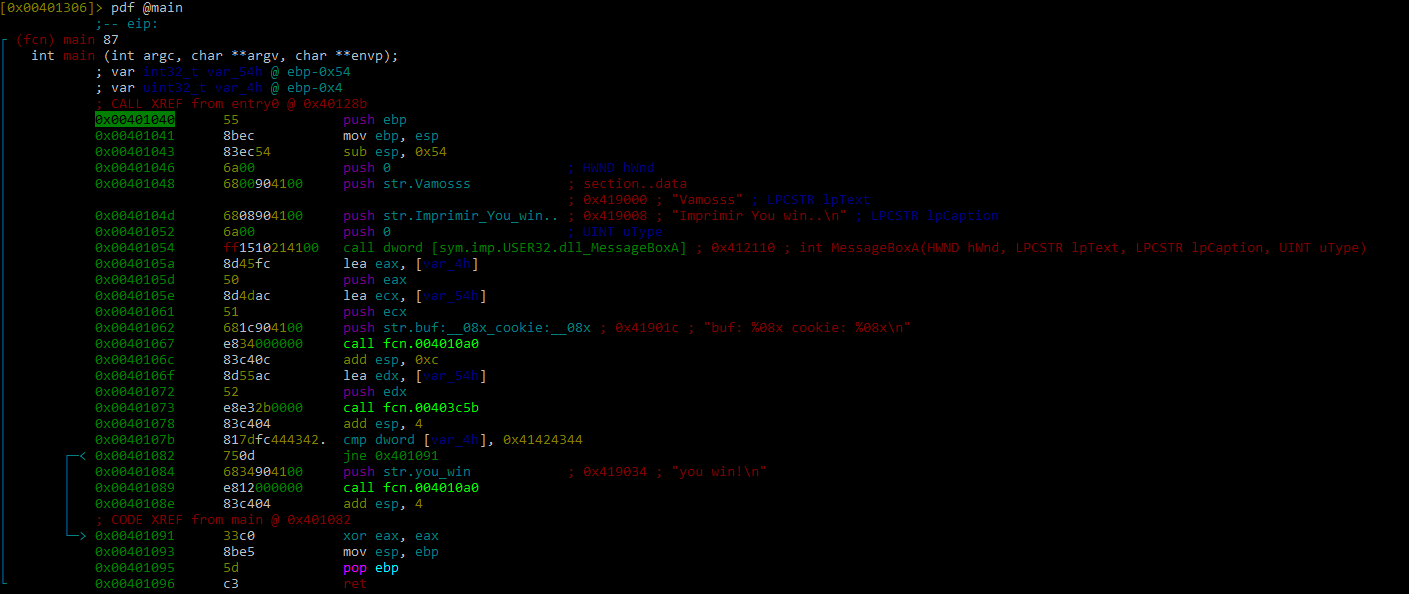
With the instruction eco we can list the themes. For example, I used “bright,” because it looks clearer.
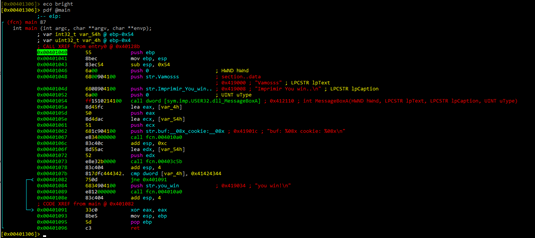
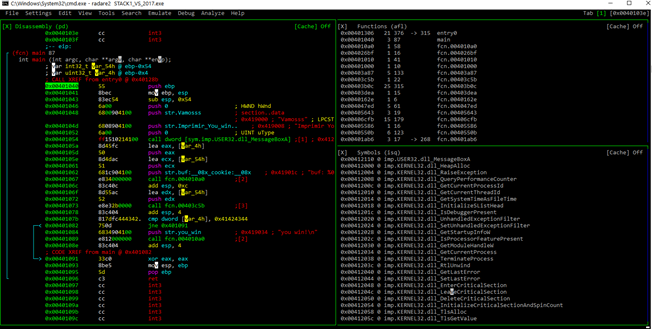
Radare has both the command based console mode, as well as a visual mode which is entered by typing the key v. Visual mode can be exited by typing q.
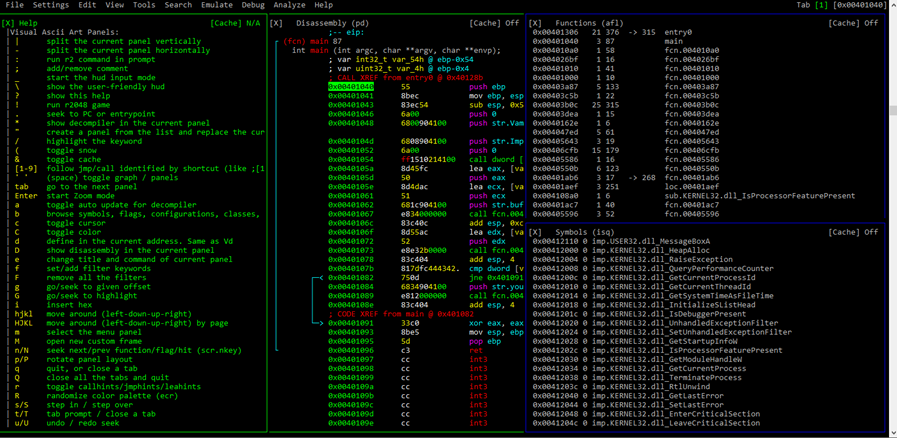
If you want to see and use the cursor, type c. Help is accessed by typing h.
For this exercise, we’ll stay in console mode. Later, we’ll use the visual mode, as well as Radare’s GUI, Cutter.
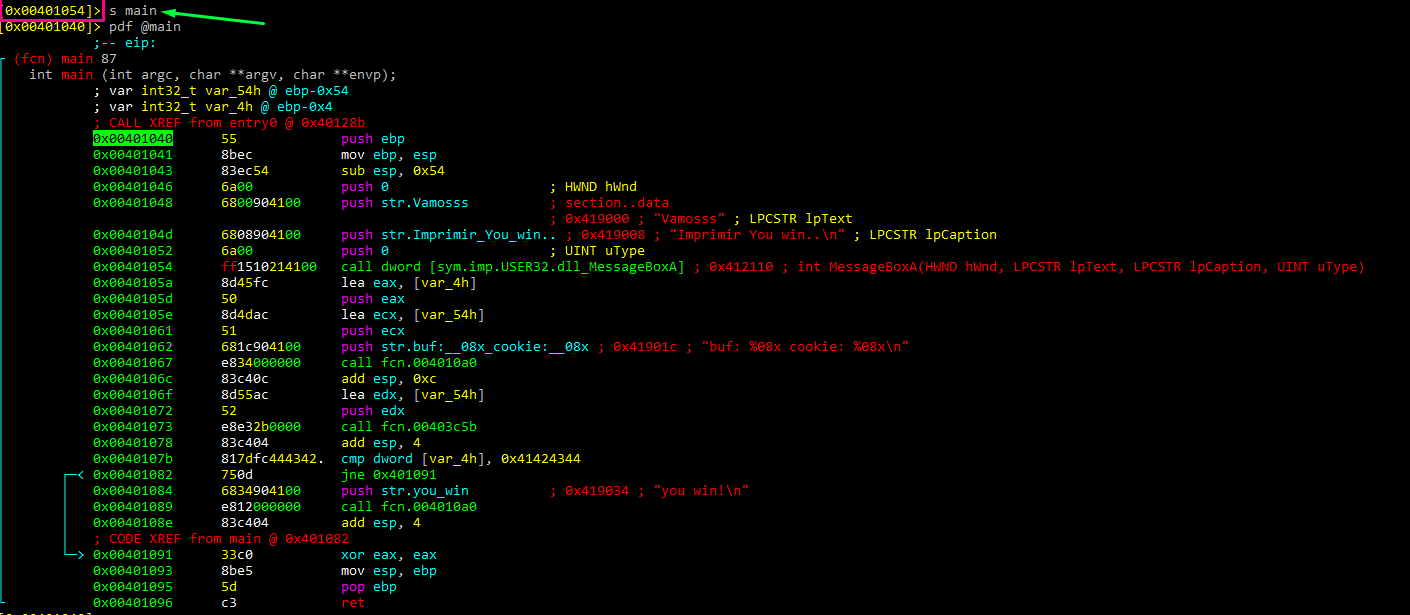
Currently, the cursor is located in 0x401054. To move to main, write s main. This simplifies things, because it takes the actual address that the cursor points to as a reference. In this case, 401040 is the main address.
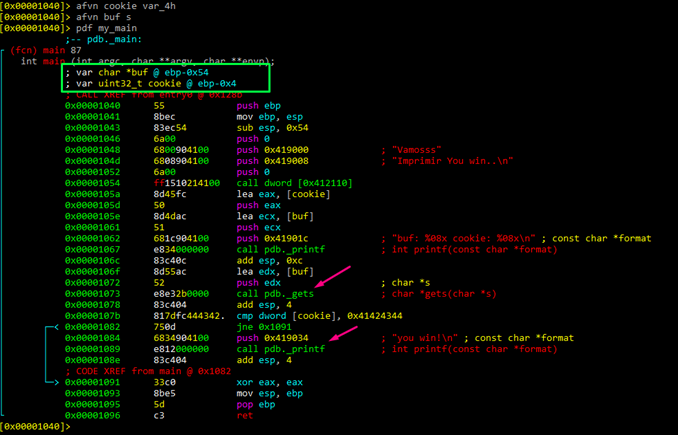
Next, let’s change the function’s name with afn.
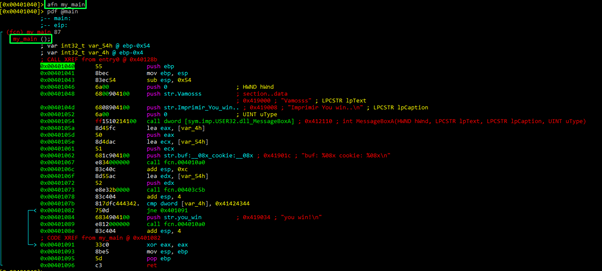
Now we can disassemble using the new name “my_main.”
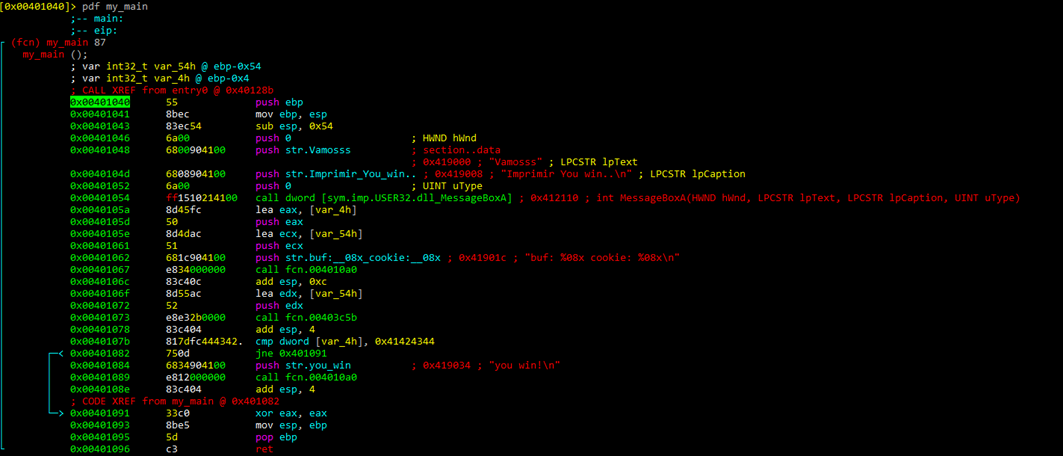
We can then rename the variables with afvn new_name old_name.
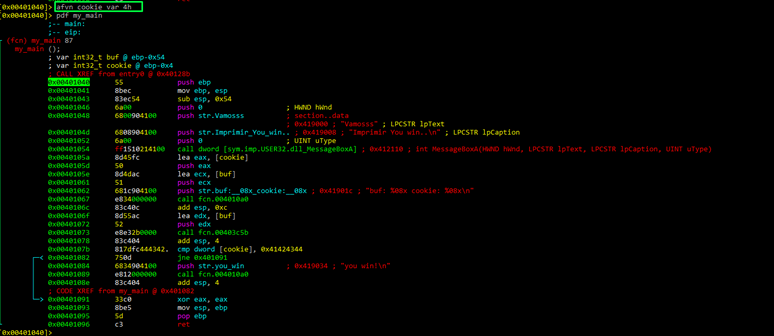
As we can see, in the function all names have been changed to new one.
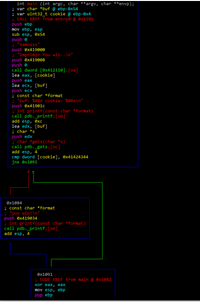
With the command agf we can see an ASCII visual representation of the function.
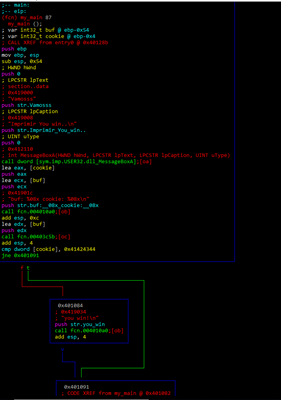
While we can see the green arrow (true) and the red arrow (false), and the comparison with 0x41424344, we can’t see the gets.
Let’s include the pdb symbol information with the command idp.
idp STACK1_VS_2017.pdb
If we analyze again with aaa and the newly added symbols, the gets and printf now appear, though we have to again rename the symbols. Remember to load the symbols at the beginning before analyzing with aaa. Otherwise, we would lose all the work done previously.
Now let’s see how this appears in Cutter, Radare’s GUI. First we need to download it, uncompress it, and run it.
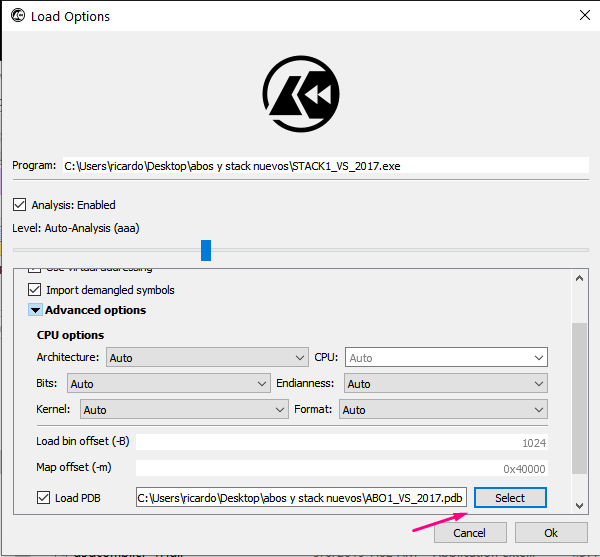
Choose the file to disassemble and the pdb with the symbols.
In the quick filter, write main. We can see the function, clicking it and pressing the bar key to enter in graph mode.
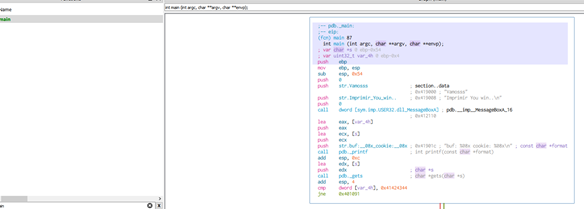
Right-clicking a variable or pressing the shortcut Y we can rename a variable.

For example, we can change the names for buf and cookie.
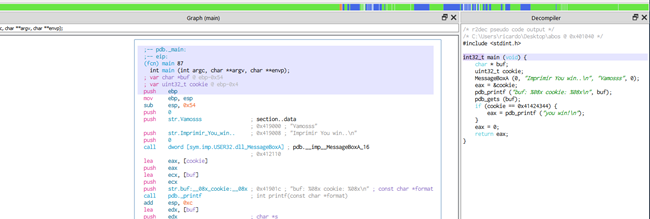
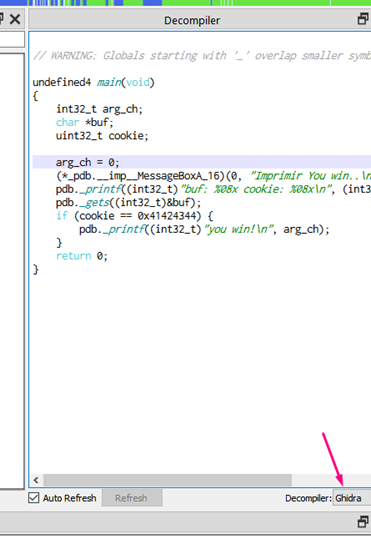
Cutter also has a screen for decompiling.
Pressing the X function shows the different references.
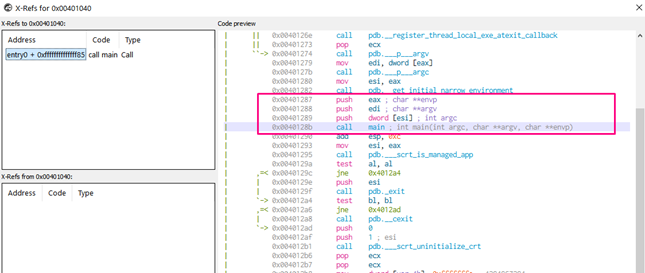
For example, we can see that one of the decompiler options is with GHIDRA, which we’ll be using later on.
Using the console for Radare commands, we can write afvb* to list the variables relative to ebp and afvd to see the value of the variables when we’re debugging.
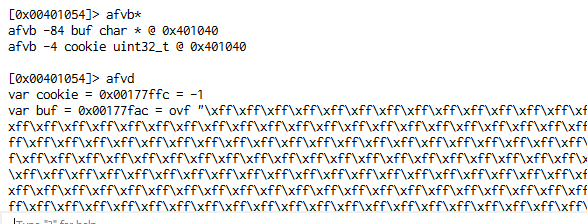
We can see that buf is in -84 and cookie in -4, so the difference between both is 80. We have to fill buf. We can also see that the next 4 will be the famous “DCBA”.


In the end, we can reach the same conclusions that we came to using IDA: the destination of gets is buf, data will be copied there, buf is 80 byte long, and right below buf is cookie. Additionally, we will modify buf with DCBA at overflow, which will be compared with 0x41424344, and it will successfully conclude with YOU WIN if nothing differs.
When writing this training I talked with Pancake, Radare’s author. I requested that he add a command similar to afbv* not just for listing variables but, similarly to IDA, for listing all the static representations of the function to make it easier see the distance. He has begun work on it, so look out for it in future trainings.
3-GHIDRA
Since part 2, a new version of GHIDRA has been released. Be sure to update to 9.1 before continuing.
https://ghidra-sre.org/releaseNotes_9.1_final.html#9_1
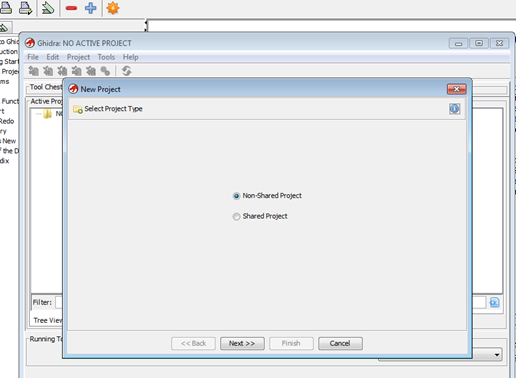
To begin, go to File -> New Project -> Non-Shared Project and then Next>>.
Create a folder for the project and write a name.
Now drag and drop the executable of stack1 on the active project screen.
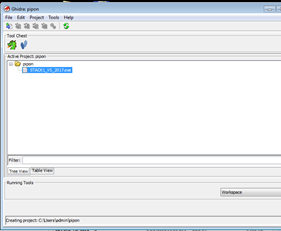
Once it’s dropped into the window, it will begin to load.
When a screen appears with information about the file that we loaded, press OK.
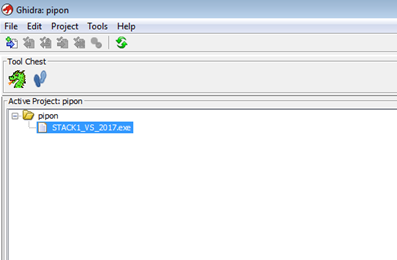
Double click on the name of our file so we can begin our analysis. If any screen appears, select YES.
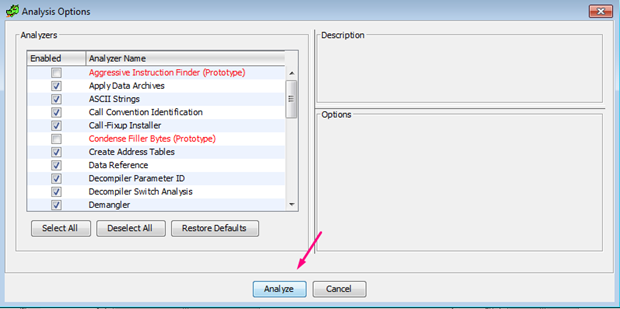
While running the analysis, we’ll come across a problem in loading the symbols, causing an error.
ERROR: Unable to locate the DIA SDK. It is required to load PDB files.
* See docs/README_PDB.html for DLL registration instructions.
ghidra.app.util.bin.format.pdb.PdbException: ERROR: Unable to locate the DIA SDK. It is required to load PDB files.
*See docs/README_PDB.html for DLL registration instructions.
We can see what this file is:
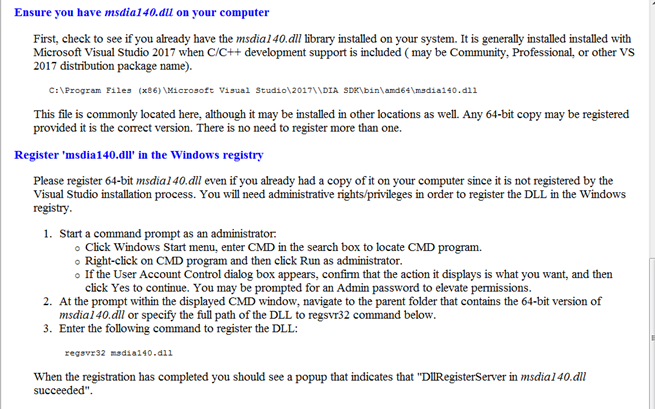
We will have to find this library and install it:
Microsoft Visual C++ Redistributable for Visual Studio 2017
or
https://go.microsoft.com/fwlink/?LinkId=746572
If you still have a problem, you can also try downloading this:
https://github.com/MalwareTech/MSDIA-x64
After uncompressing it, run the .bat from an admin command prompt, producing the following script:
xcopy msdia140.dll %systemroot%\system32
regsvr32 %systemroot%\system32\msdia140.dll
It’s possible to do this without bat file by running these commands manually. If you use the .bat solution run Ghidra again, repeating the process. It will load the symbols directly. Otherwise, you can go to FILE -> LOAD PDB FILE to load them in WINDOW -> FUNCTIONS
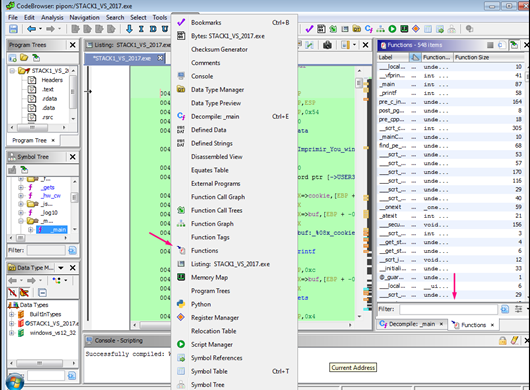
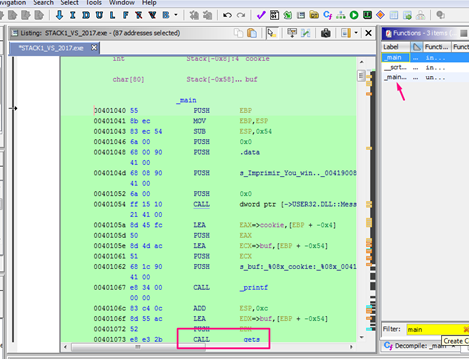
We can write main and search the function. There we can see the main function and we can see the gets call, so we know we have properly loaded the symbols.
In WINDOW -> FUNCTION GRAPH we can see the graph with function blocks.
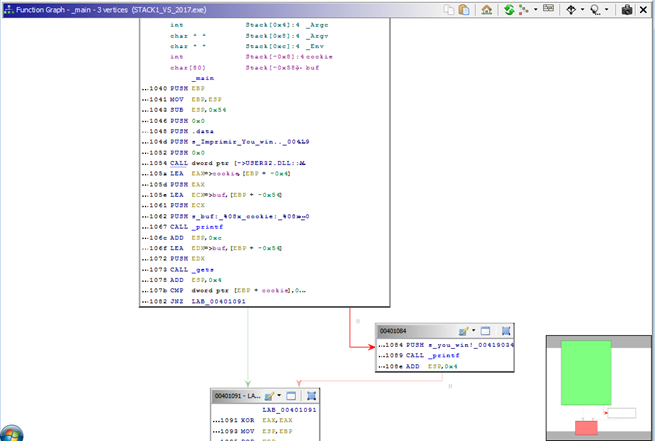
Some details are not seen by default, but the graph is interactive, and hovering the mouse above shows details as to what is below.
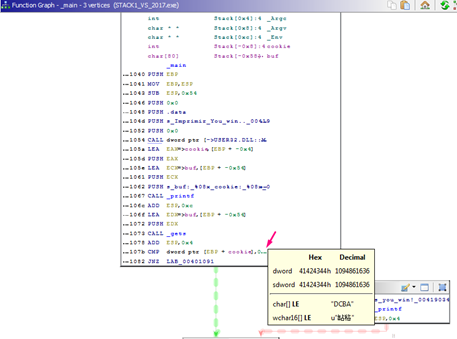
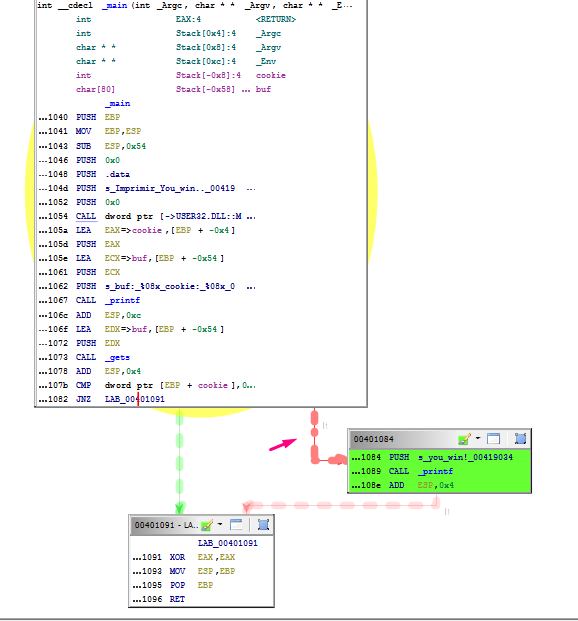
We can paint the blocks, rename them, and make other changes.
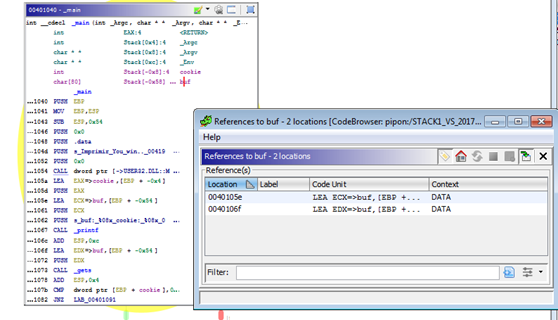
Find the variable references (where a variable is used) by right clicking -> REFERENCES.
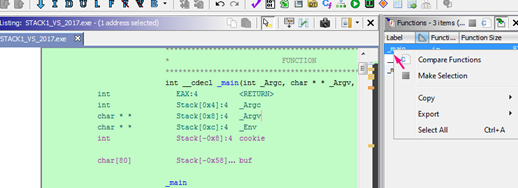
If it was not selected, mark the function, and right click MAKE_SELECTION.
We can see the static representation of the stack:
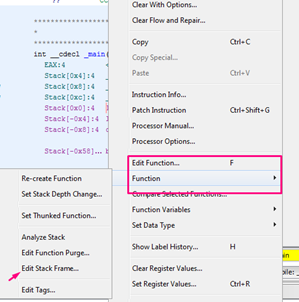
The stored ebp and the return address didn’t appear as DWORDS so press ‘B’ to change variable type until we get the DWORD option.
The stack appears quite differently from how it did in IDA:
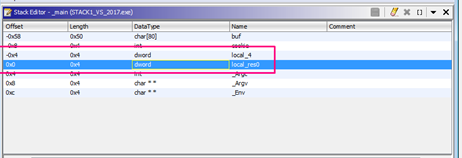
We can see in hexadecimal the distance of buf to cookie: 0x58 - 0x8 = 0x50.
We can change it to decimal in the menu by right clicking.
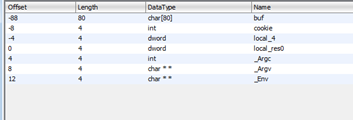
Now that it’s in decimal, it is clearer that we have to write 80 ‘A’s because 88 is the buf’s offset, and subtracting 8 of cookie makes the offset 80. We can fill buf, then write 4 bytes more for “DCBA,” writing the same script that we did with the previous static disassemblers.
There are some differences from the IDA static representation worth noting. Instead of taking ebp as reference, it takes the return address. So, instead of being buf in 0x54, it is in 0x58 because the STORED EBP is above 0 (RETURN ADDRESS) while in IDA it was under 0, as it was taken in reference the EBP.
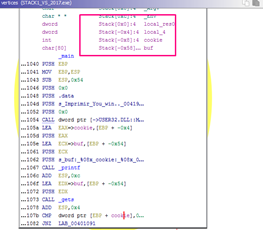
Some of the variables do have an offset between Ghidra and IDA. For instance, buf is listed at -0x58 in Ghidra, while in IDA it was -0x54.
This has come up for other users, and is listed in github as an issue:

This is a little bit confusing since we now have EBP as reference, but have worked with return address as the reference. We’ll remain aware of it in a more complex analysis.
There’s also an interactive decompilation window in the menu WINDOW. Each marked line appears in the disassembler.
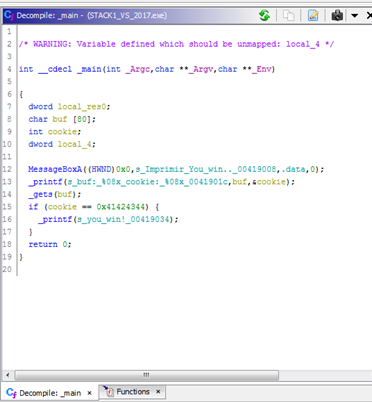
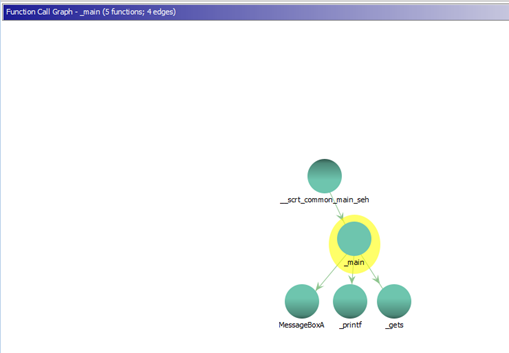
CALL GRAPH
For the next exercise, we’ll work with stack2.
Exercise Stack2
IDA Free
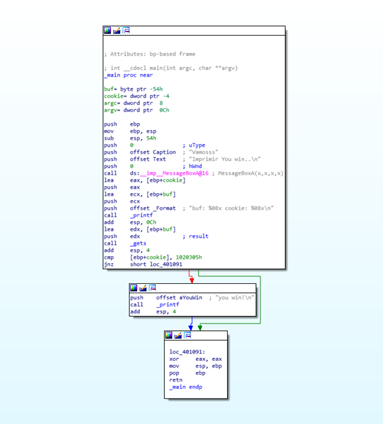
While the buf and cookie sizes didn’t change, it is now compared with 0x01020305.
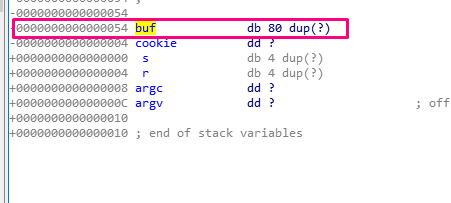
The buf size is 80 and underneath, cookie is 4 . So as buf is the parameter of gets, what we write will be saved there.
Filling buf with 80 bytes, with 4 more bytes we can modify cookie as we have before. This would make the script read as:
import sys
from subprocess import Popen, PIPE
payload = b"A" * 80 + b"\x05\x03\x02\x01"
p1 = Popen(r"C:\Users\<user>\xxxxx\abos y stack nuevos\STACK2_VS_2017.exe", stdin=PIPE)
print ("PID: %s" % hex(p1.pid))
print ("Enter to continue")
p1.communicate(payload)
p1.wait()
input()
The payload is:
Because of the Little Endian, 05 03 02 01 is what’s saved in memory, and becomes in the comparison: 0x01020305.

Radare2
Now let’s see it in Radare. We should open it with:
r2 <executable_name>
or
radare2 <executable_name>

Then load the symbols:

Then we analyze with aaa:

And then afl to print the functions:
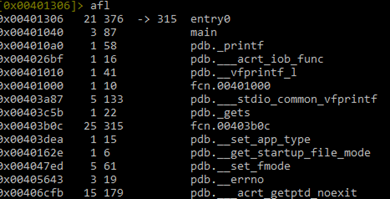
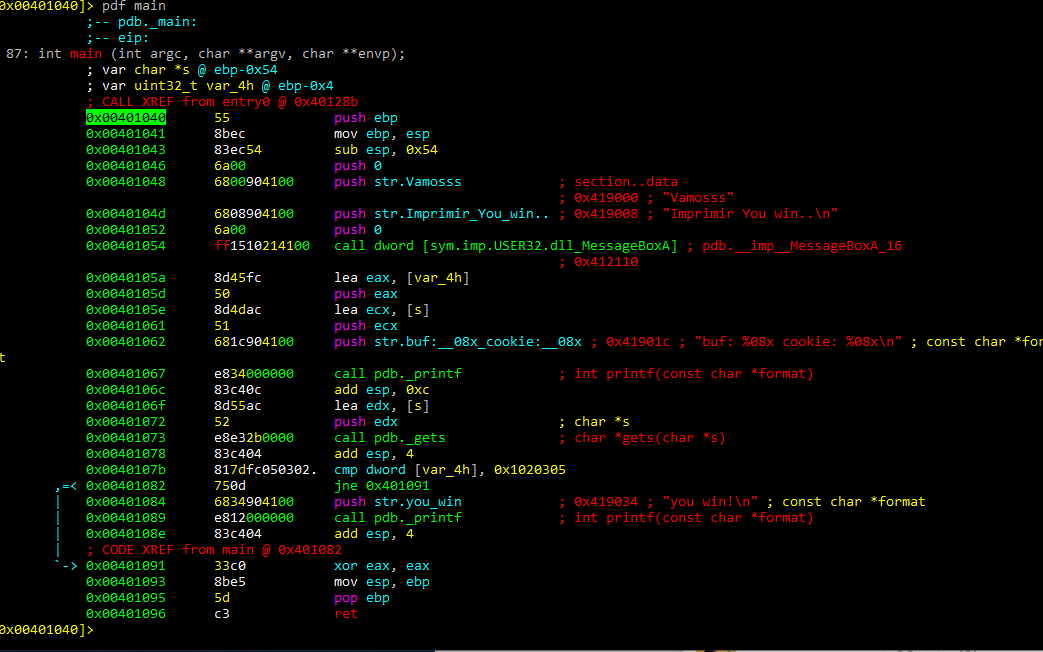
We can see the main function, so we should move to that function with s main, then eco bright and pdf main to disassemble it:
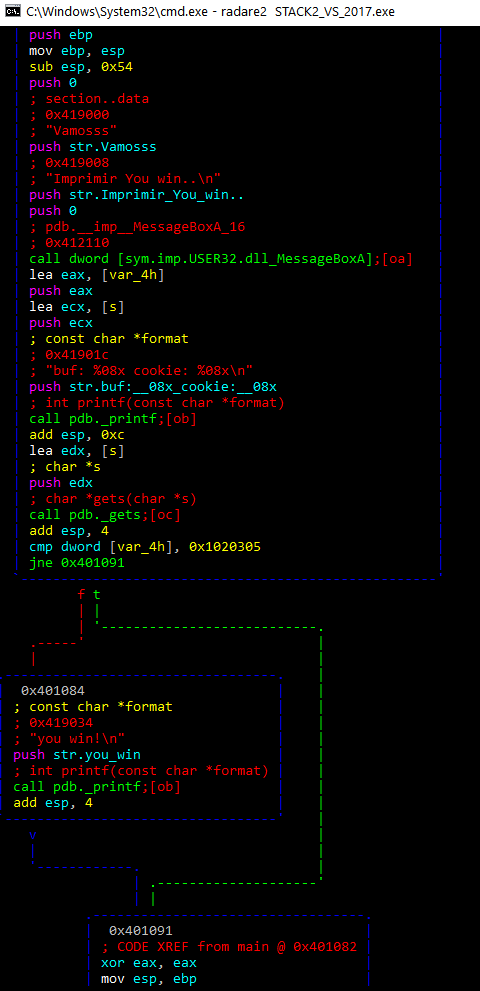
With the command agf we can see the ASCII visual representation of the function:
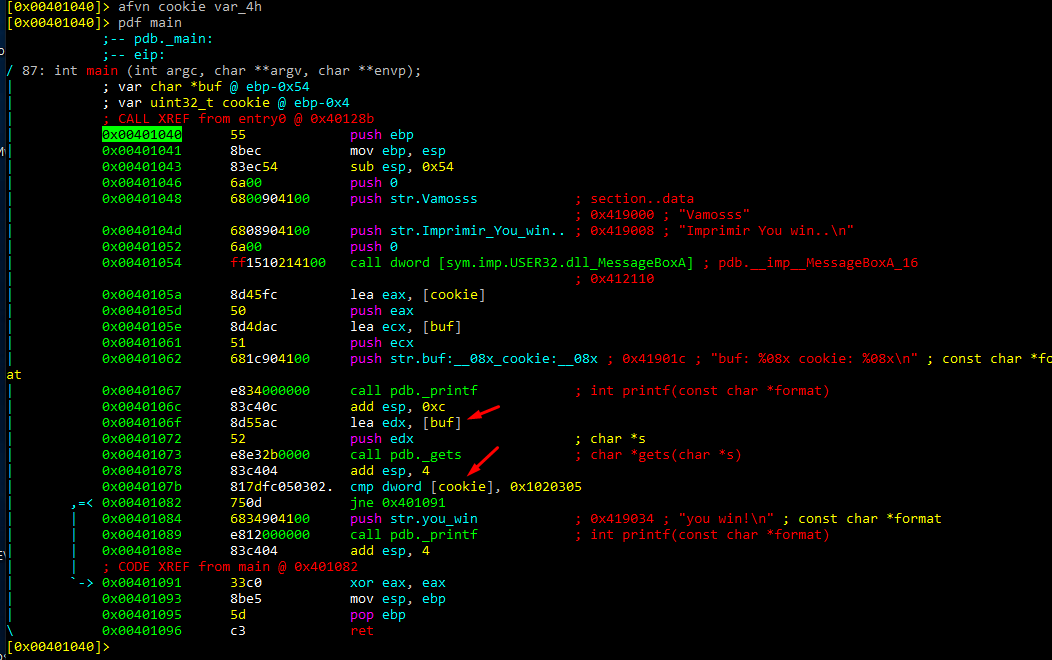
We can then rename the variables.
afvn new_name old_name
afvn cookie var_4h
afvn buf s
To see the variables, write afvb*
It’s the same as the way IDA displays the variables, with EBP as a reference.
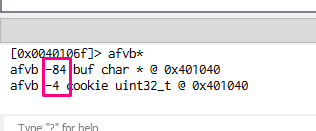
We see the difference 84-4 that gives us the length of buf. Buf is 80 and with 4 bytes more we can modify cookie with “\x05\x03\x02\x01”
If we open it with Cutter, we can see the graph option:
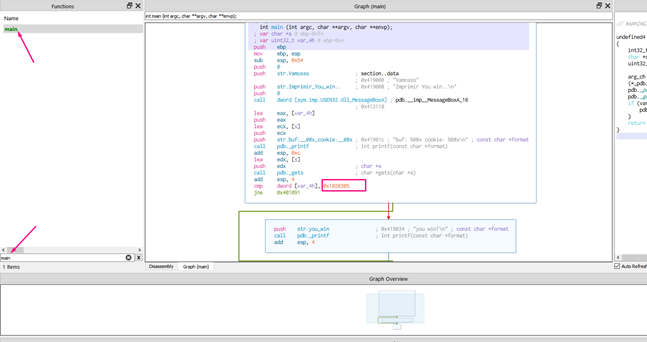
Rename the variables.
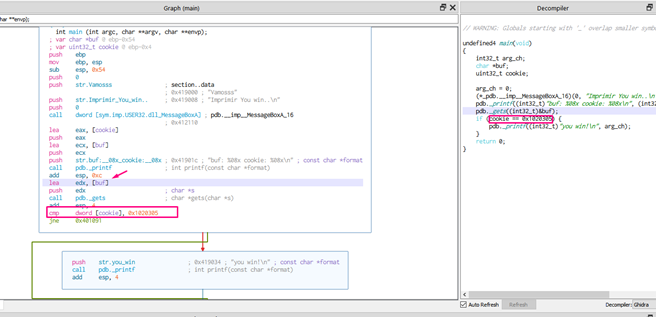
We can see the new names in the decompiler, with everything else staying the same.
We can see the sizes with the same command of radare2 afbv*
payload = b"A" * 80 + b"\x05\x03\x02\x01"
And we can see that the script works:

Ghidra
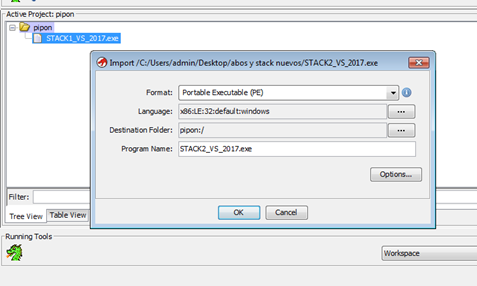
Drop this new file in the same project as the first exercise:
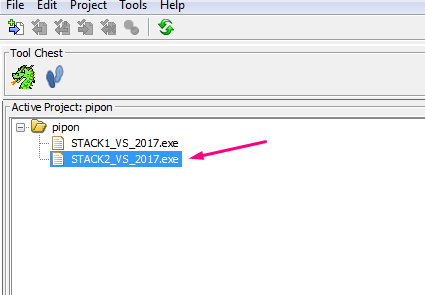
PDB may have a little error—it has worked in previous disassemblers. If there is an error, we will do it without the symbols by looking at the strings.
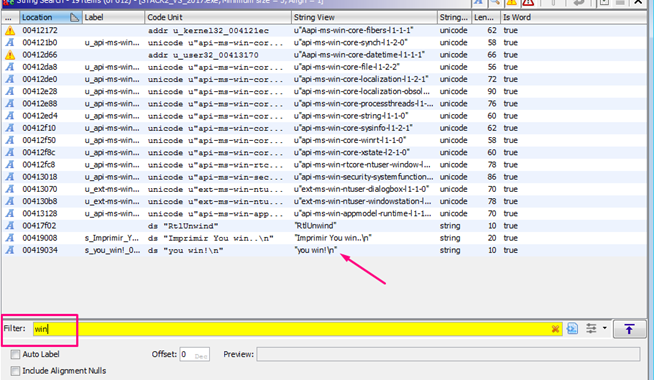
Double click on the area where the pink arrow is pointing.
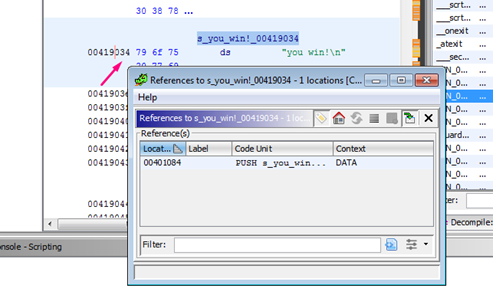
To search the references of the string,right click REFERENCES -> SHOW REFERENCES TO ADDRESS.
Rename it to main by right clicking -> EDIT FUNCTION.
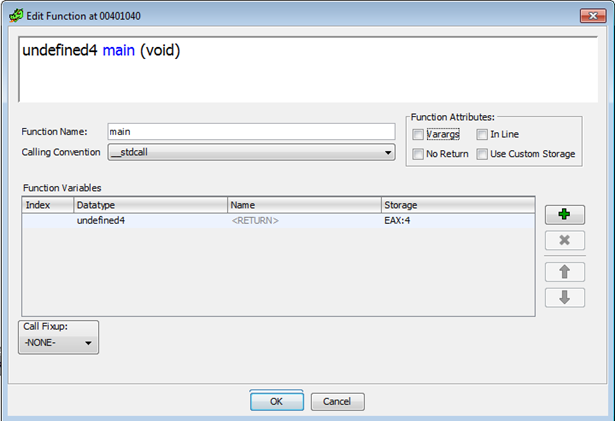
In the function list, search main and right click -> MAKE SELECTION. Select the function GRAPH in the WINDOW.
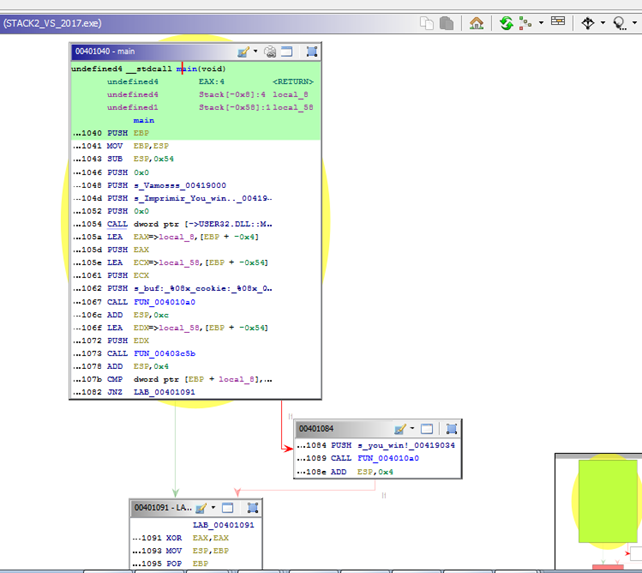
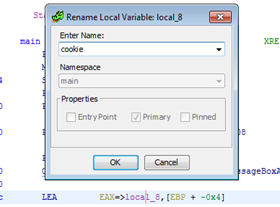
Rename by right clicking -> EDIT LABEL
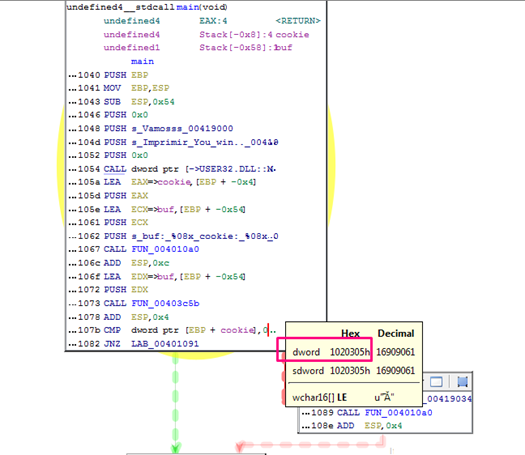
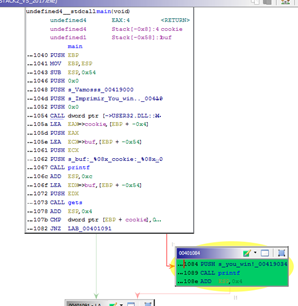
We can see that it compares cookie with 0x01020305. We can also see the variables but since we don’t have the symbols we can’t see the gets. However, we can rename the function 0x403c5b manually.
Now it looks better:
Now, let’s take a look at the variables:
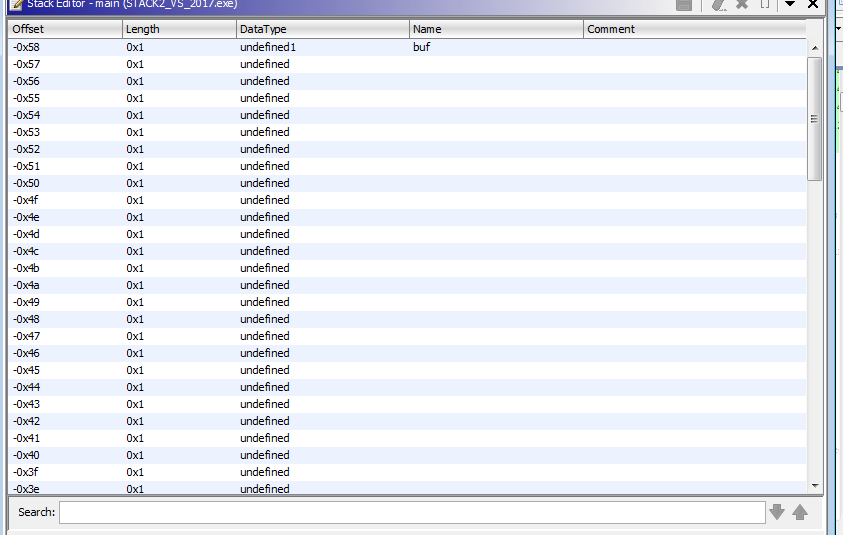
As there aren’t symbols, we don’t know the buf length, so we need to create an array:
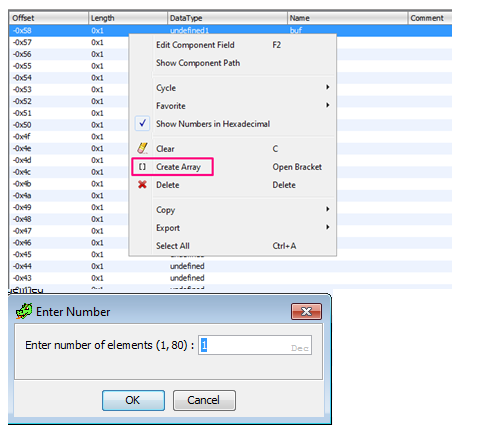
Length can vary from 1 to 80. Since we know that cookie is right below, we should write the maximum 80.

We can change types with letter B, but even with correct size, it will show as unknown. If we modify DataType manually, we can write the type. For example, we can write char[80], instead of unknown. We can do the same happen dwords, changing it manually to a known type from a list.
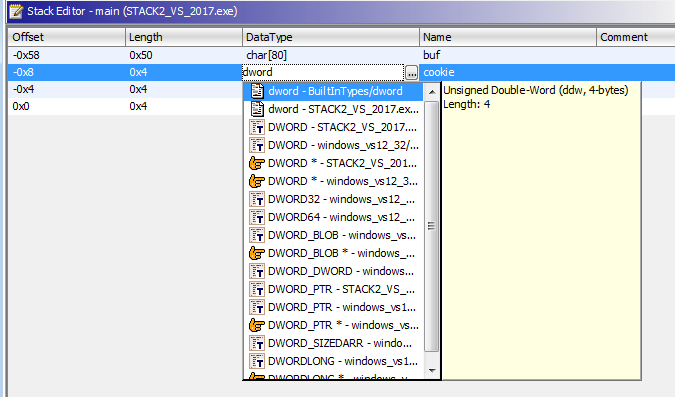
We know that buf length is 0x50, because is 0x58 - 0x8 = 0x50 or 80 in decimal, and as before are 80 ‘A’s and then b”\x05\x03\x02\x01”.
As we go into more complex exercises, we will discover new possibilities about these tools, finishing the left stacks and following with more complex exercises.
