Pen testing is a dynamic process that requires practitioners to exploit an environment to expose security weaknesses. In order to do this safely and efficiently, pen testers enlist the help of different tools. This article series will focus on reversing and exploiting Windows using free and easy to get tools, such as IDA FREE, Radare, Windbg, X64dbg, or Ghidra.
We’ll begin with tool installation. From there, we’ll explore vulnerability theory, and then conclude with some examples of exploitation.
Installation
First, let’s install the tools to set up our work environment.
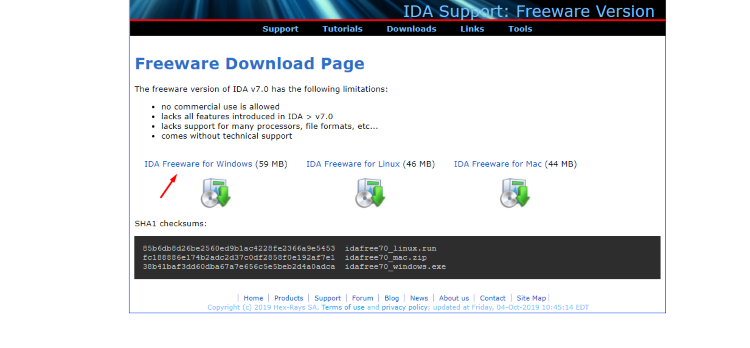

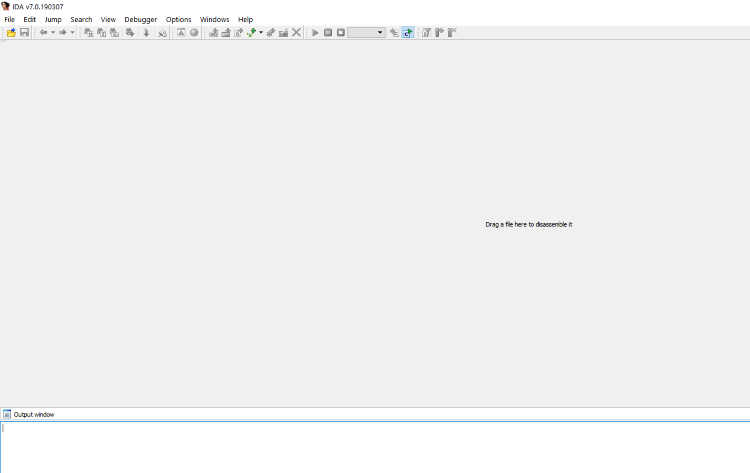
Download the file idafree70_windows. Follow the installer instructions to get IDA FREE running on your machine quickly.


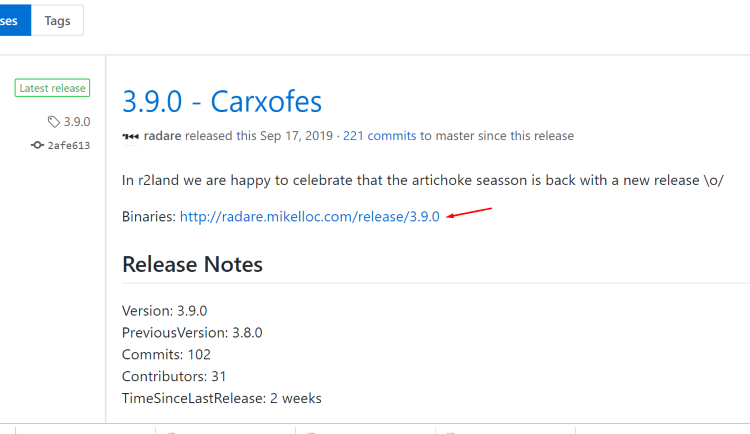
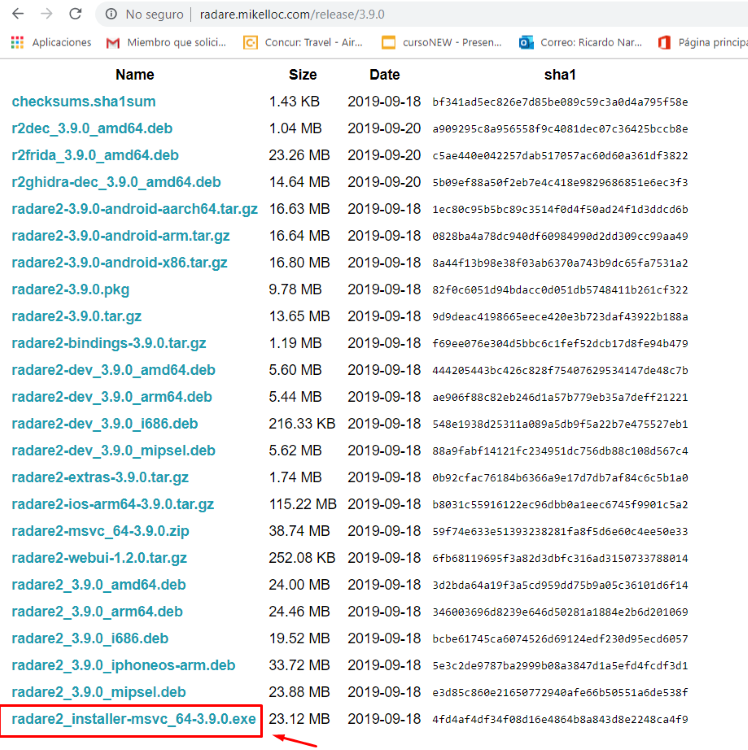
Download the latest installer for Windows.

Once installation has finished just include the path where radare was installed into the environment variables.
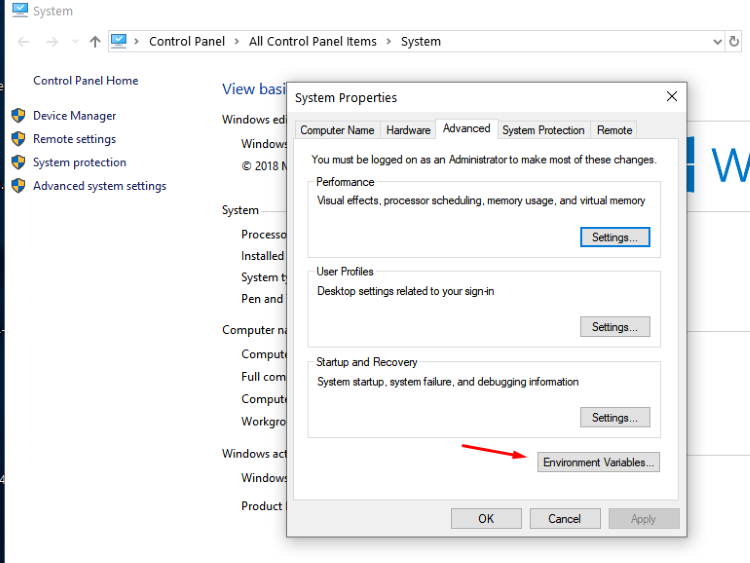

Inside of the environment variables, go to the variable path and include these two lines (write your own paths if installed elsewhere):
C:\Users\<user_name>\AppData\Local\Programs\radare2
C:\Users\<user_name>\AppData\Local\Programs\radare2\bin
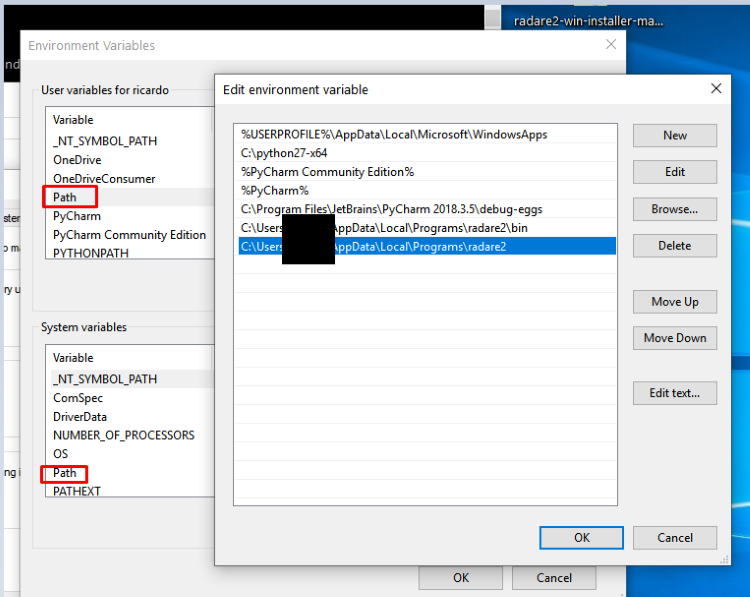

Windows should now recognize the command radare2 when prompted.


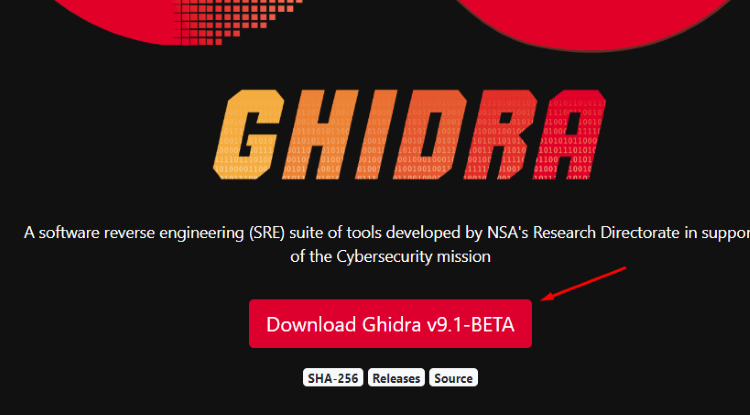
Download the zip file and decompress it wherever you want. For example, you could use a Virtual Machine in VMWARE.
Once the tool is decompressed, install Java from the Oracle webpage. GHIDRA recommends version 11 for compatibility. (Once the installer has finished, include the java path where the java executable is located (usually the bin path) in the path environment variable as seen before.
Alternately, other users of GHIDRA recommend the version 11 of the OpenJDK.

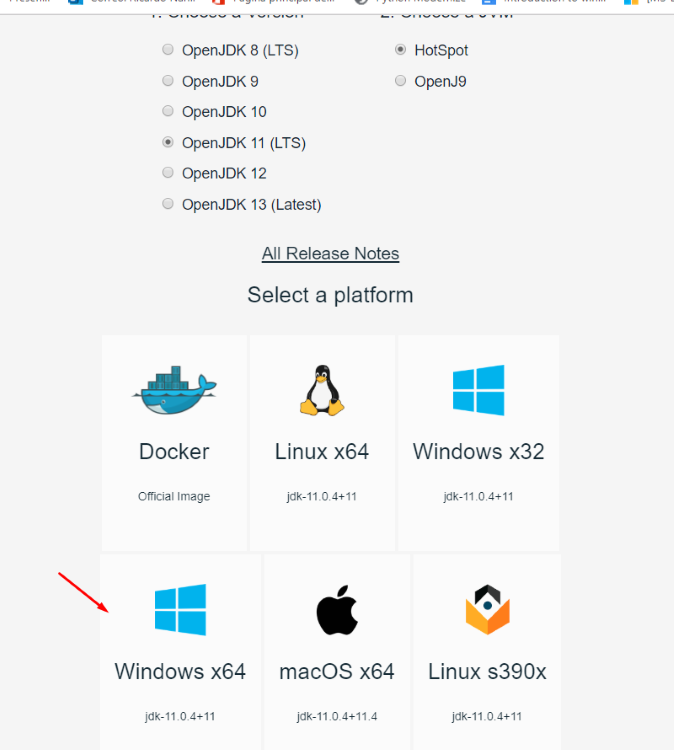

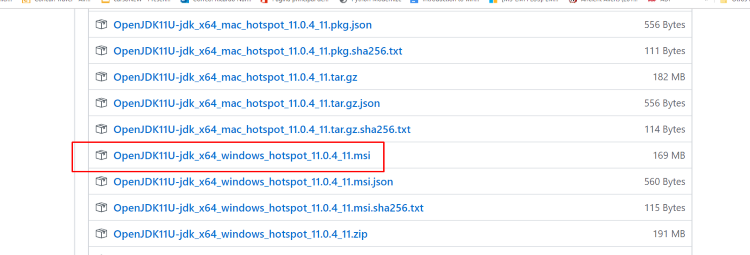
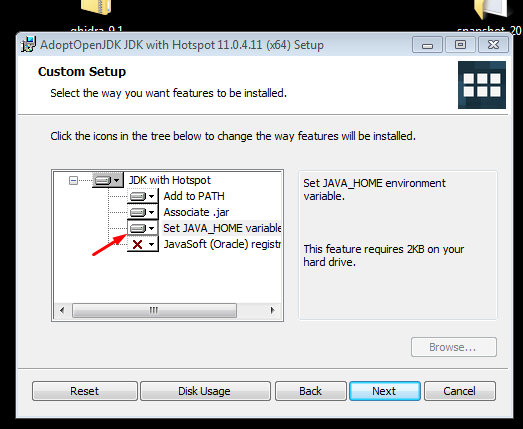
While installing with the OpenJDK installer, it’s possible to automatically add it to the variable PATH:

Once Java is installed in your environment, you can begin to run GHIDRA.

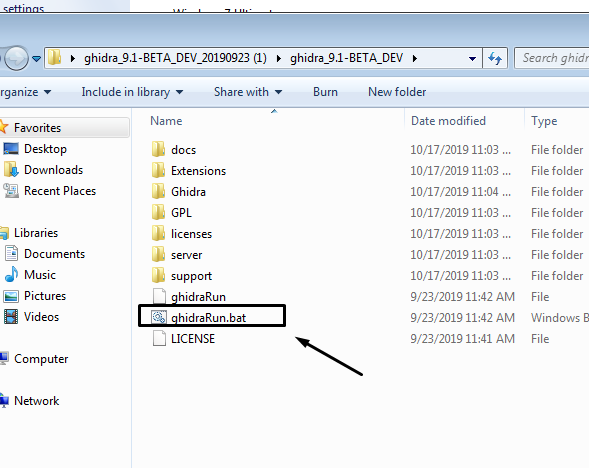
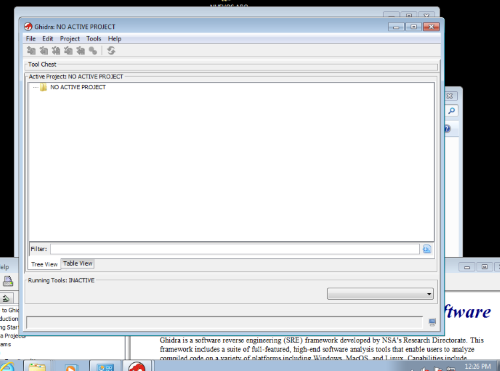
Click the bat file, and GHIDRA will boot up:

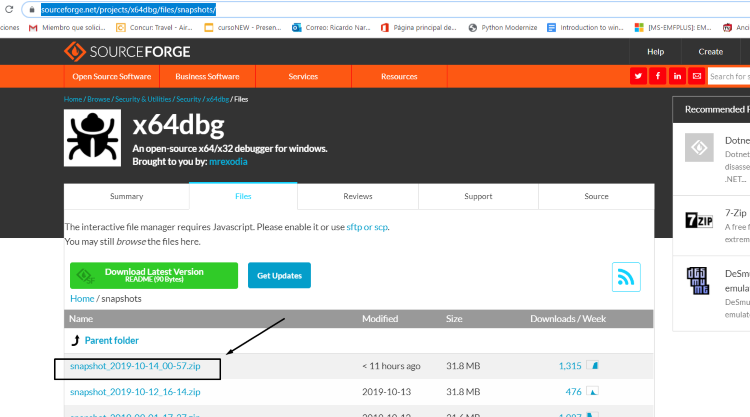
There are new snapshots of x64dbg almost everyday. Go to the sourceforge web page and install the latest version:

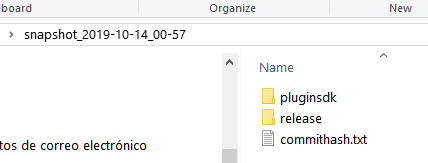
Once you have unzipped the file, move it to the release folder:
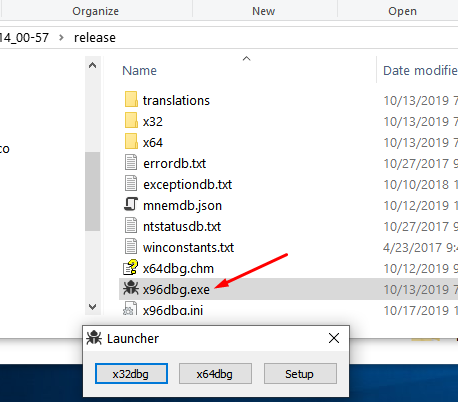
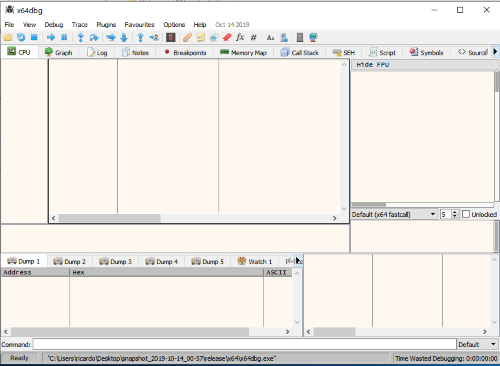
When you run it with administrator privileges, a launcher appears for you to choose which version you would like to run (32 or 64 bits).


Snowman was originally part of x64dbg. Now it’s a plugin we can download and install, which will decompile our binaries. Download it and copy it inside of plugins folder.
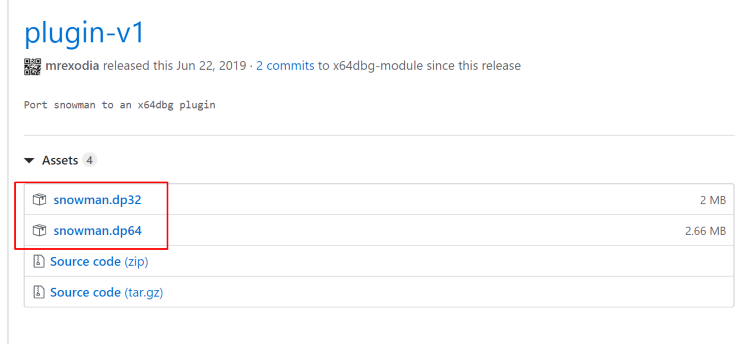

The version with 32 bits goes to 32 bits plugins folder, and the 64 bits version goes to the 64 bits plugins folder.


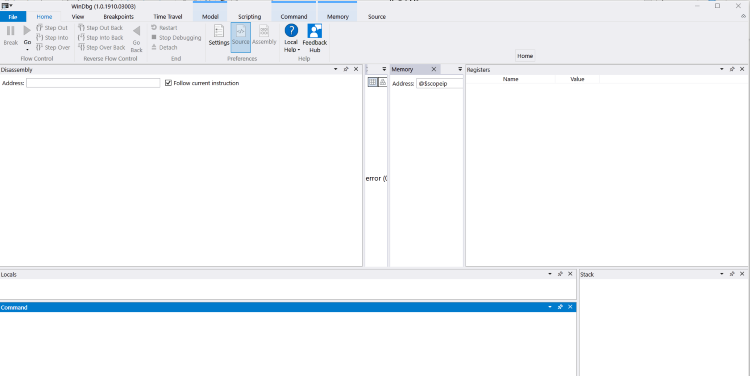
If you have Windows 10, to install windbg you just have to go to the Microsoft store and search for WinDbg.
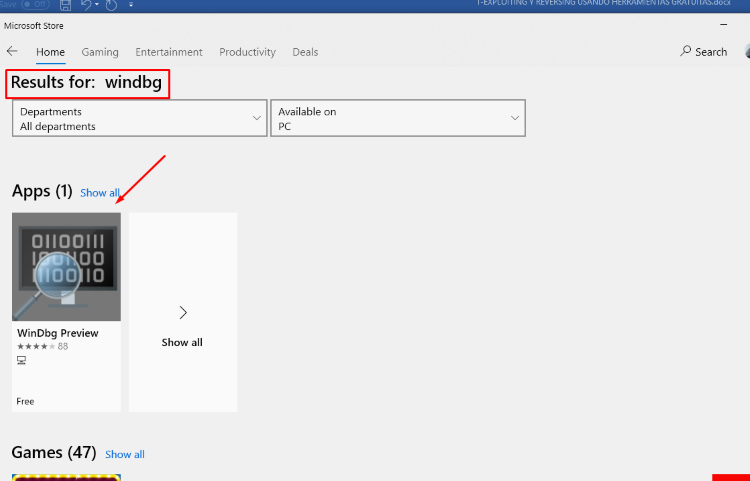

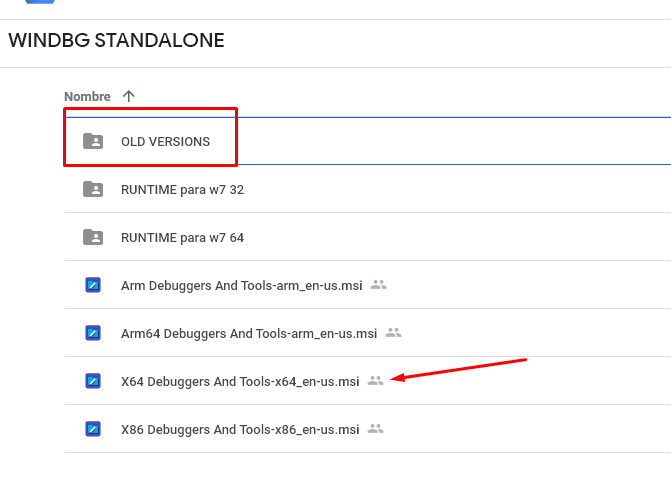
WinDbg Preview will install automatically. If you have the Windows 7, you’ll have to install a previous version.
There you have some older versions:
Next step, configure symbols for WINDBG, create the folder symbols in “C:\” and then go to environment variables and create the variable _NT_SYMBOL_PATH.
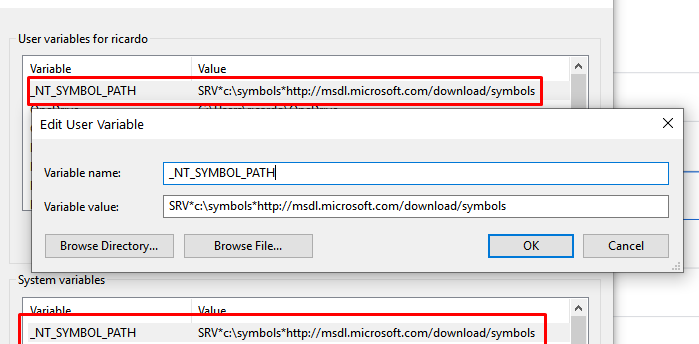
As value write:
SRV*c:\symbols*http://msdl.microsoft.com/download/symbols
With this we already have installed WINDBG PREVIEW.

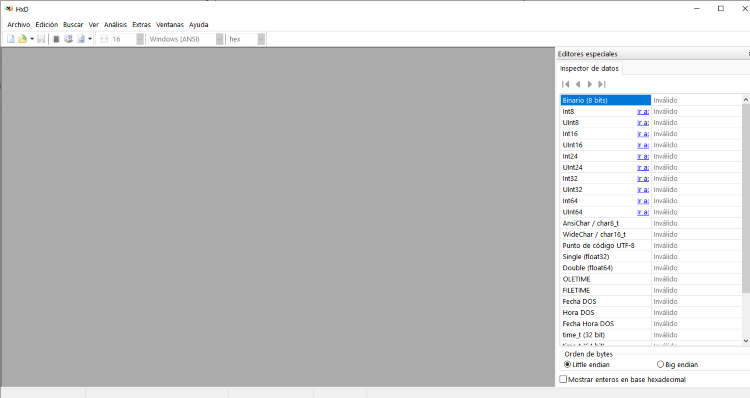
This free hexadecimal editor will allow you to edit binary files.

The newest version of Python 3 will help create the exploits for each exercise.
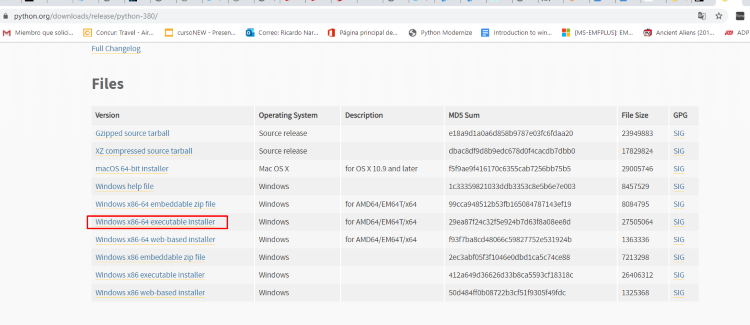

Download the latest version.
Find and select the option in the installer to aggregate Python.exe to the PATHenvironment variable automatically.
Usually the installation path will be:
C:\Users\XXXXX\AppData\Local\Programs\Python\Python38
Python38 may be different in your case.
Once installed, you should be able to execute Python as needed.

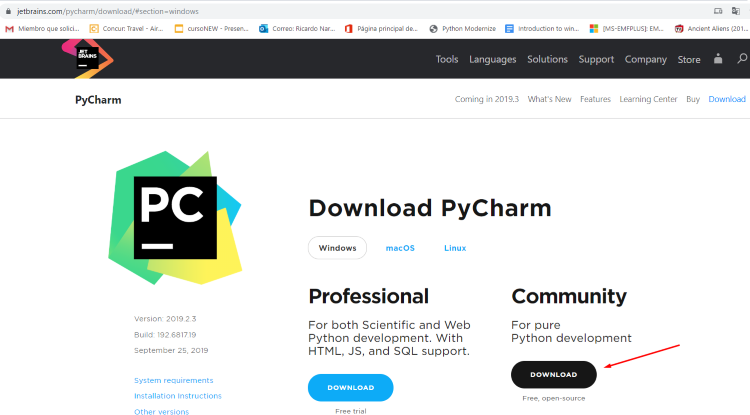
Pycharm will be our Integrated Development Environment (IDE) for Python. Go to the jetbrains web page and select the latest version.

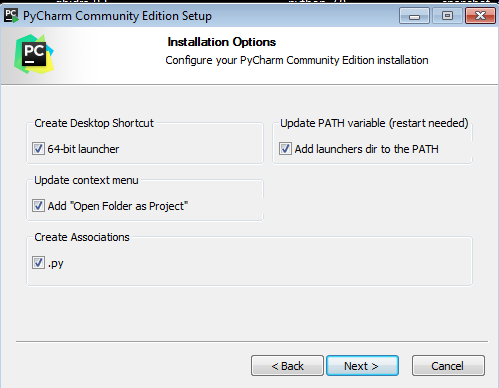

Select all of the above options, so it will be included in PATH environment variable. Once installed, create a new project:

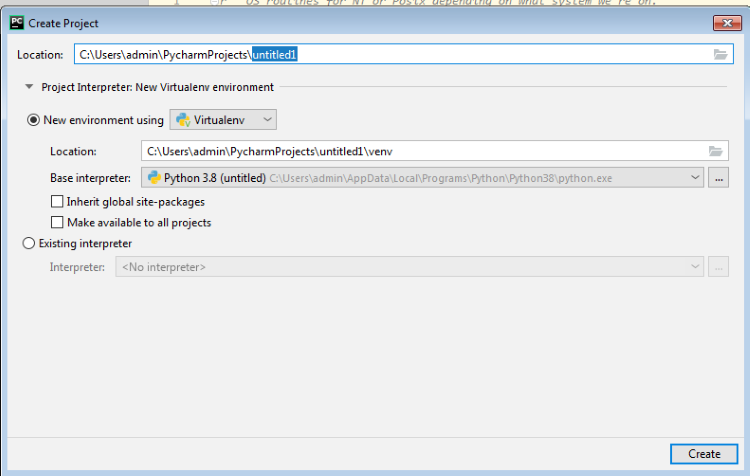
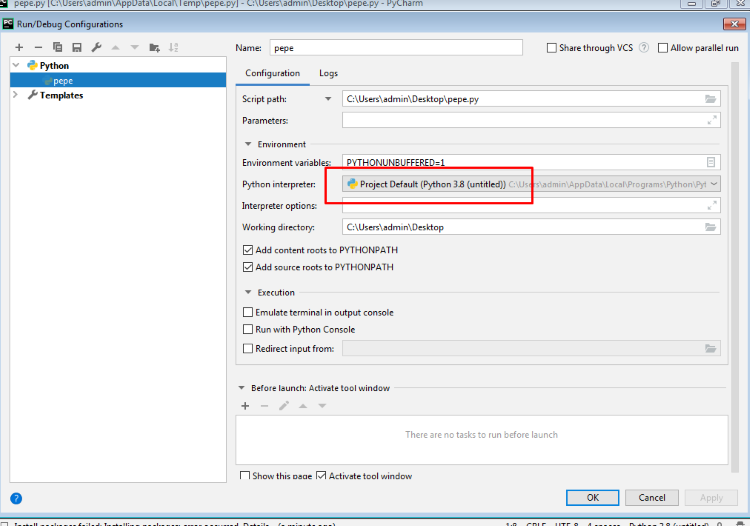
Check the RUN->DEBUG configuration and verify that the “Base interpreter” option points to the correct Python interpreter.

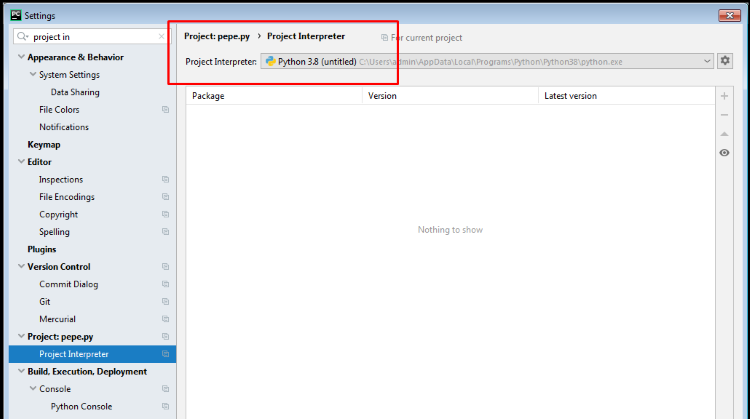
Search in settings for ”project interpreter” and check that the correct version of Python is detected.

This will allow you to create .txt files, change to .py extension and move them into Pycharm.
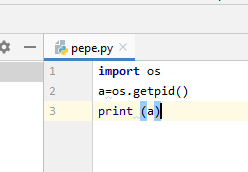
For example, a sample file named pepe.txt has been renamed into pepe.py and dragged and dropped into Pycharm. When you click “Run,” the next screen should appear:
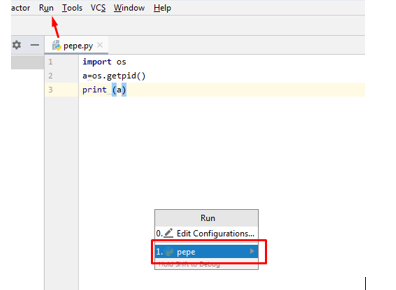
The console of the pycharm screen should print:

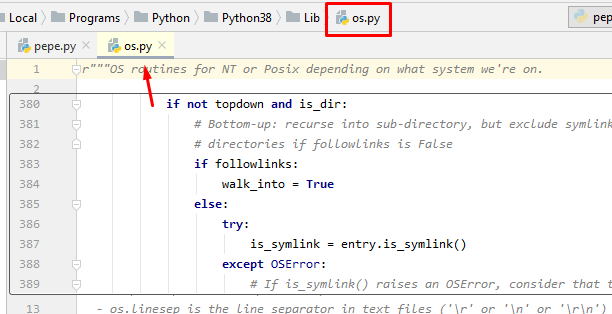
Pycharm features autocomplete. For instance, if you point with the mouse to the word “os”, and press Ctrl and click, pycharm should take you to the code of “os” python library.
Now that you’ve installed the right tools for our exploiting environment, you’re ready to move on to part two, which will begin with a little bit of theory about buffer overflow. From there, you’ll complete a few simple exercises.
