Getting Started with Core Impact | User Interface
This video provides an introduction the Core Impact's graphic user interface (GUI) to help you quickly navigate and save time with your pen tests. This session covers:
- Overview of the home page
- Where to go to install new updates
- How to switch between views in the console
- and more
Homescreen
This will come up whenever you first start Core Impact. It allows you to create new workspaces, open workspaces, open teaming workspaces, generate reports, remediation validation, and more. It is also where new update notifications will show in the bottom right hand corner.
Console screen
To navigate to the main console screen, you can select 'Open Workspace' on the left-hand panel. Once in the console, you'll see several it is divided up into several different sections.
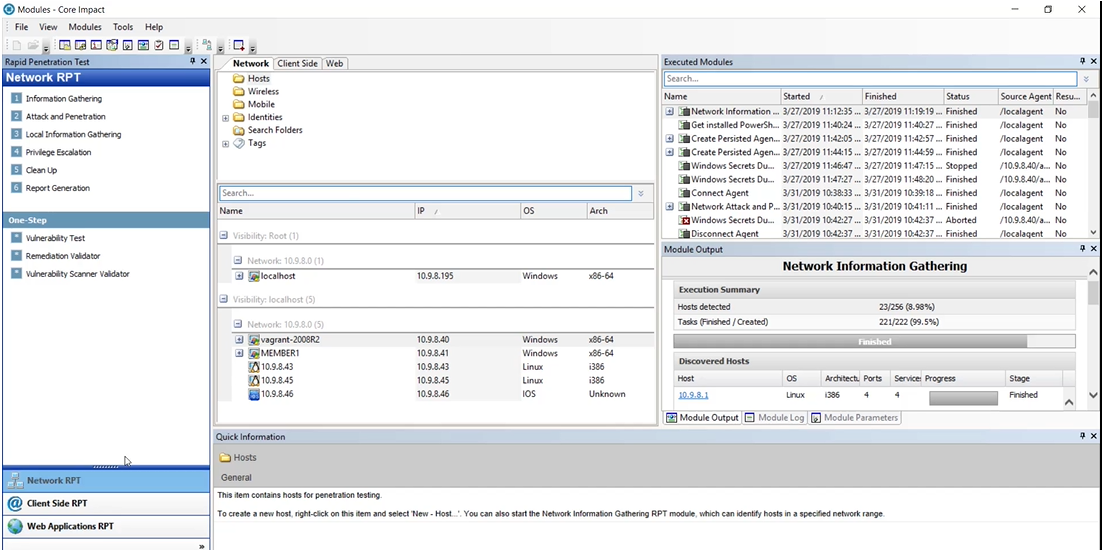
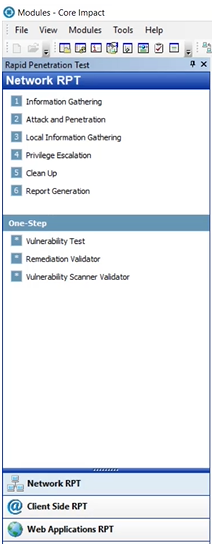
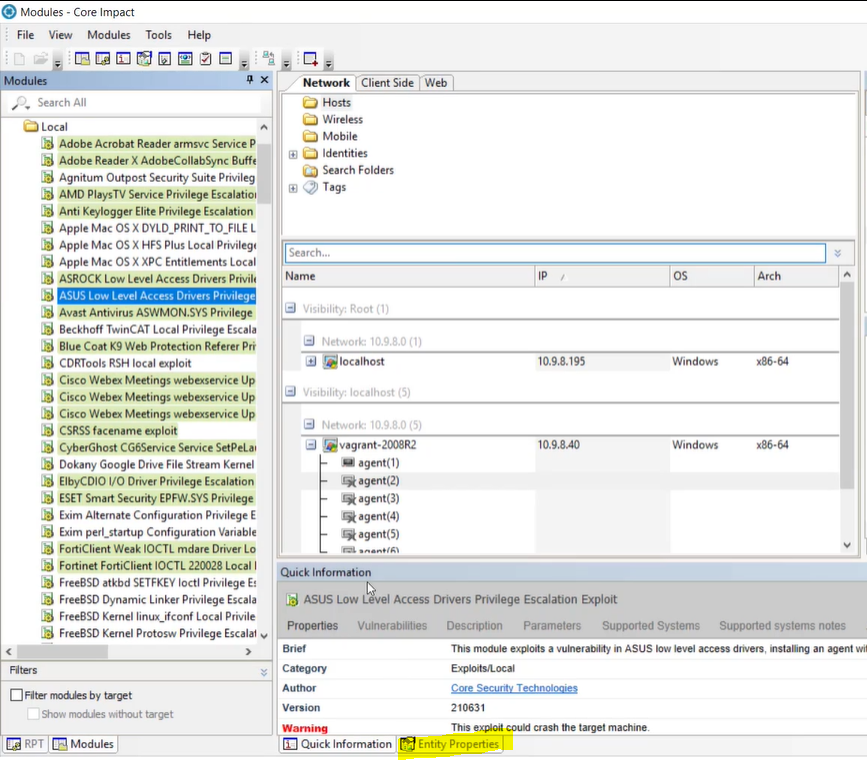
Rapid Penetration Test (RPT) window
The Rapid Penetration Test (RPT) window is also known as the modules window, as you can navigate to the modules from this view. This window provides access to the Network RPT, Client Side RPT, and Web Applications RPT in the bottom left corner. You can drag and drop any of the RPTs or modules onto hosts or agents.
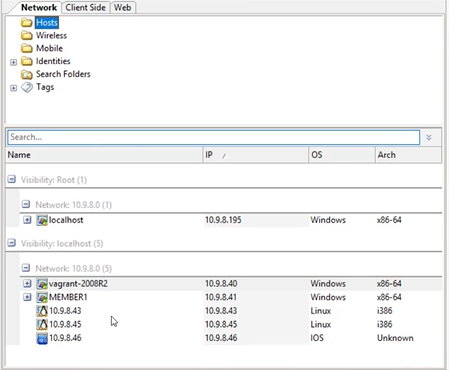
Entity View Panel and List
In the center of the console, is the entity view panel. This panel allows us to do a variety of things, including:
- Look at our hosts
- Search through identities found during a pen test
- Search tags if attached to items, including cameras, network devices, web servers, and databases
Anything selected in the entity view panel will populate details in the entity view list box beneath. In this panel, you can see:
- Agents that are either disconnected or connect
- Hosts
- Identities within the selected filters
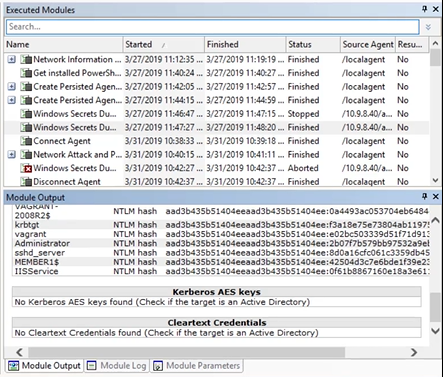
Executed Modules and Module Output View
The Executed Modules list shows all of the modules used since the workspace was created. If you click on an executed module, the output will be displayed in the Module Output View below. It can also show the module log and the parameters which it ran under.
Quick Information View
This will display high level details on whatever area you click on the console screen. For example, if you click on Attack and Penetration Wizard, the Quick Information panel will populate a short description. This panel is particularly helpful when looking at things like exploit modules. By clicking on entity properties, you'll be provided with more detailed information.
Console Interactions
The console displays will change depending on what type of test you are working on. For example, if you switch from a client side pen test to network side test, it will switch the RPT window as well as switching the entity view panel.